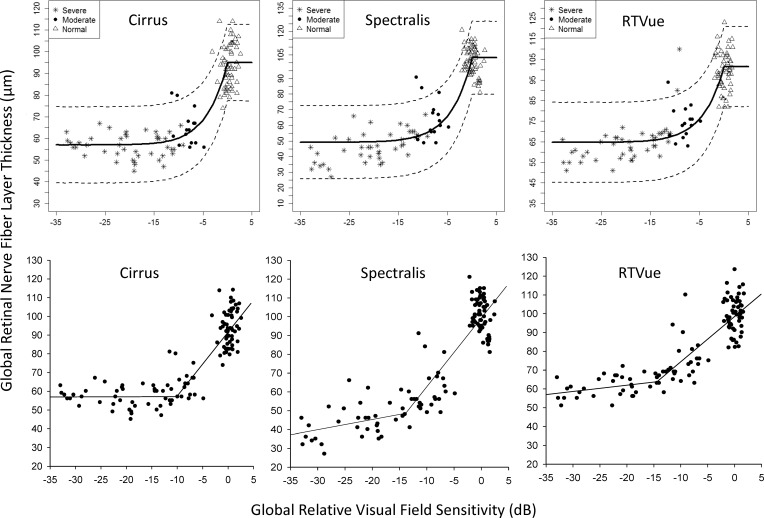
Figure 1.
Bayesian change point plots (top row) and simple linear regression plots (bottom row) of the structure–function relationship of average RNFL thickness measured with Cirrus (A), Spectralis (B), and RTVue (C) with SAP average relative VF sensitivity. On simple linear regression plots, the meeting point between the two regression lines provides the coordinates of the amount of VF loss and corresponding residual layer thickness.

