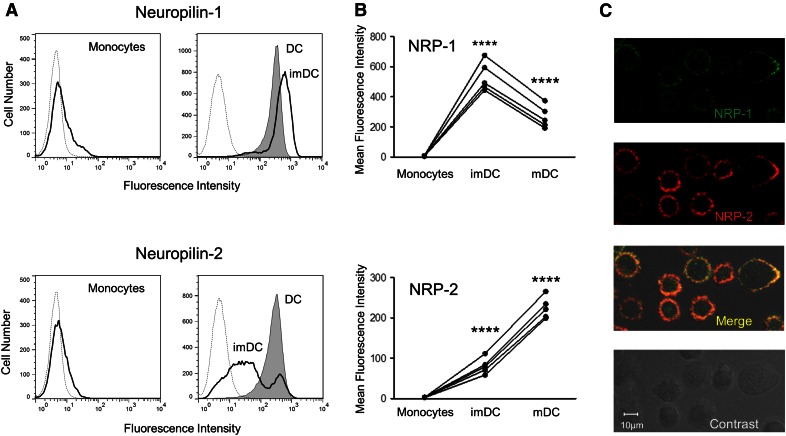
Figure 1. Dissimilar patterns of expression of NRP-1 and NRP-2 during differentiation of DC.
The amount of NRP-1 (A, upper) and NRP-2 (A, lower) on the surface of intact human monocytes (solid lines, left), imDCs (solid lines, right), and mDCs (shaded regions, right) was determined by flow cytometry after cells were stained with anti-NRP-1 or anti-NRP-2 IgGs or isotype control IgG (dotted lines, left and right). The mean fluorescence intensity of staining for NRP-1 and NRP-2 on monocytes, imDCs, and mDCs from 5 donors is shown (B). The change in average mean fluorescence intensity of imDCs compared with monocytes and of mDCs compared with imDCs, shown from 5 donors, is significant (****P < 0.0001). Surface expression of NRP-1 (C, top) and NRP-2 (C, second from top) on mDCs is shown by confocal microscopy. Bleed-through for red and green dyes was checked before acquiring data to secure color separation. The results shown in A from 1 donor and in B from 5 donors are representative of data from 7 different donors (all shown in Supplemental Table 1), and the micrographs in C are representative of staining of mDCs from 3 different donors.

