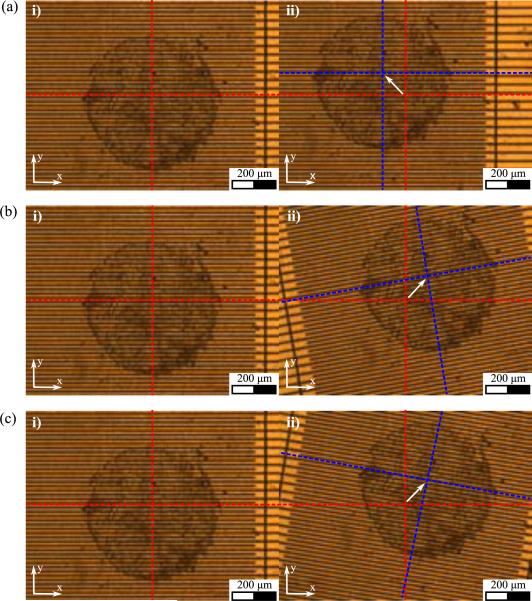
Fig. 10.
Tissue core images at the initial and final position (x,y) and orientation θ (a) Experiment (1): [xd, yd, θd]T = [−100μm, 100μm, 0°]T, (b) Experiment (2): [xd, yd, θd]T, = [100μm, 100μm, 10°]T, and (c) Experiment (3): [xd, yd, θd]T = [100μm, 100μm, −10°]T. Red and blue dotted lines represent the central lines of the stage at the initial and final state, respectively. Note: αd is determined from the desired position and orientation using Eq. (11).

