Figure 1.
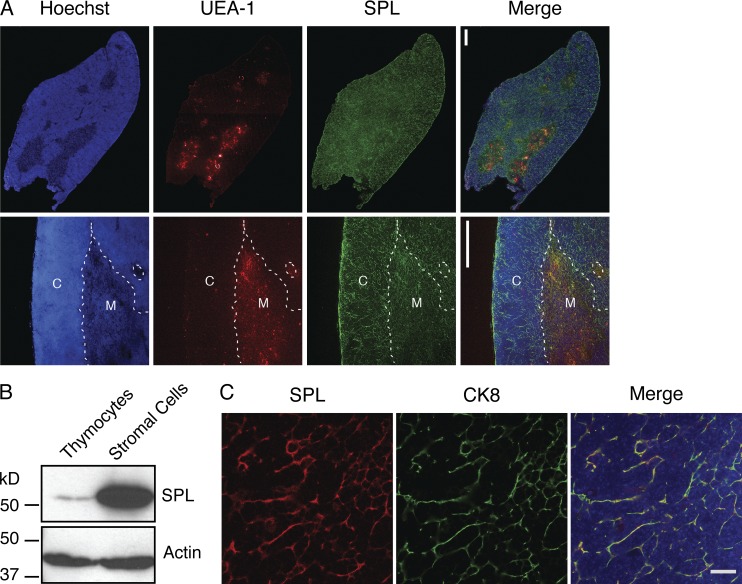
SPL is highly expressed in TECs. (A) Confocal microscopy of WT thymus sections. 6-µm cryosections were fixed and stained with a lectin delineating the medulla (UEA-1), SPL antibody, and Hoechst to stain the nuclei. The top row shows one lobe of the thymus. The bottom row shows a close-up image of the cortex (C) and medulla (M). Dotted lines delineate the corticomedullary junction. SPL is expressed in all sections of the thymus. Bars, 100 µm. Images are representative of three thymuses analyzed. (B) Western blotting to detect SPL in whole cell extracts of thymocytes and thymic stromal cells separated by mechanical dissociation. Actin was used as a loading control. (C) SPL expression in TECs by immunofluorescence detection and confocal microscopy. Thymic sections from WT mice were stained for CK8 to detect TECs and SPL. DAPI staining (blue) indicates nuclei. The merged image shows SPL colocalizing with CK8. The image is representative of three thymuses analyzed. Bar, 20 µm. Shown are the representative results of three independent experiments.

