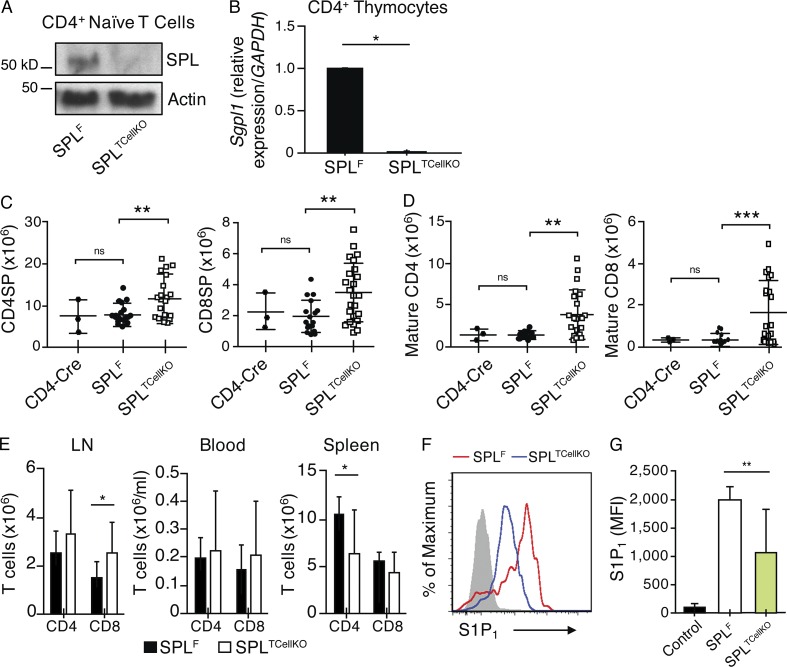
Figure 7.
SPL expression in mature T cells contributes to efficient egress. (A) Western blot to detect SPL in CD45RBHiCD4+ T cells isolated from spleens of SPLF and SPLTCellKO mice. Splenic T cells were sorted from SPLF and SPLTCellKO mice and prepared for Western blotting. Actin antibody was used as a loading control. (B) CD4+ thymocytes were flow sorted from SPLF and SPLTCellKO mouse thymuses. Purified cells were pooled from four mice/group. Gene expression of SPL (Sgpl1) was analyzed by quantitative real-time PCR. (C) Absolute numbers of CD4SP (CD4-Cre, n = 3; SPLF, n = 15; SPLTCellKO, n = 19) and CD8SP (CD4-Cre, n = 3; SPLF, n = 16; SPLTCellKO, n = 24) thymocytes. (D) Mature CD4SP (CD4-Cre, n = 3; SPLF, n = 10; SPLTCellKO, n = 18) and mature CD8SP (CD4-Cre, n = 3; SPLF, n = 10; SPLTCellKO, n = 20) T cells. (E) Absolute numbers of CD4+ and CD8+ T cells in the spleen, blood, and mesenteric LN of SPLF and SPLTCellKO mice as indicated (SPLF, n = 7; SPLTCellKO, n = 10). (C–E) Graphs represent a compilation of six independent experiments. (F) S1P1 surface abundance on mature CD4SP T cells in representative SPLF and SPLTCellKO mice as indicated. The gray histogram represents a negative isotype control. (G) Quantification of mean fluorescence intensity (MFI) of S1P1 (SPLF, n = 5; SPLTCellKO, n = 11). The graph represents a compilation of four independent experiments. (B–E and G) Mean values ± SD are shown. *, P < 0.05; **, P < 0.01; ***, P ≤ 0.001 for two-tailed unpaired Student’s t tests between SPLF and SPLTCellKO.

