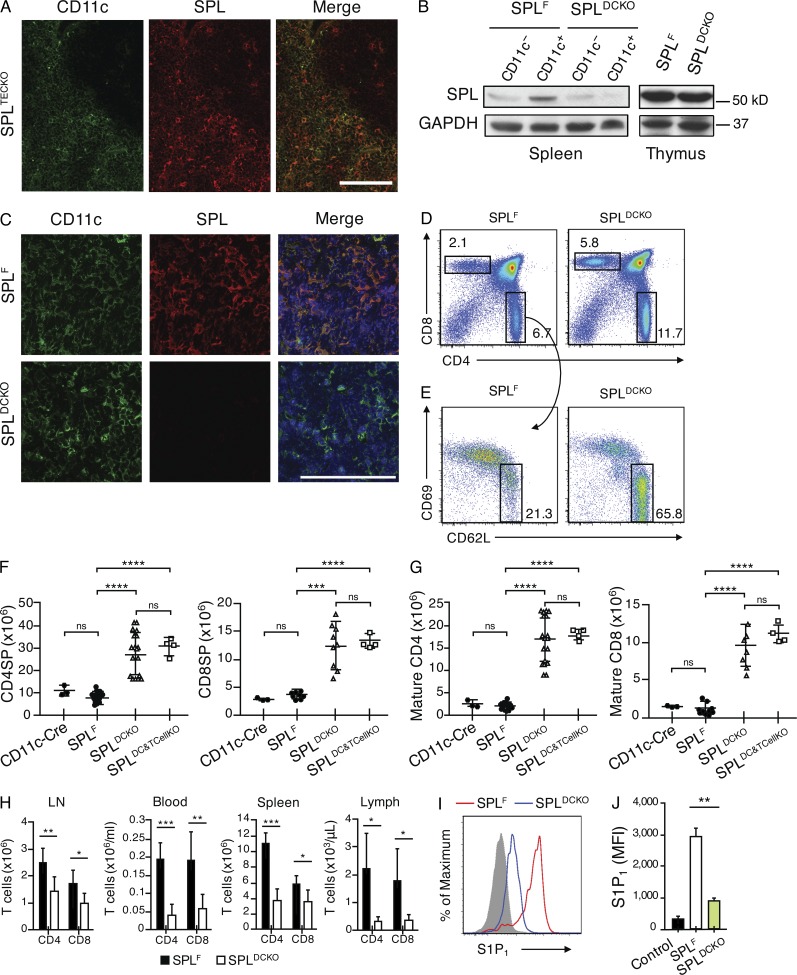
Figure 9.
SPL expression in thymic DCs is required for thymic egress. (A) Immunofluorescence was performed on frozen thymic sections from SPLTECKO mice using CD11c and SPL antibody. Bar, 100 µm. The results shown are representative of three thymuses analyzed. (B) Western blot to detect SPL in whole-cell extracts of CD11c+ DCs isolated from spleens and whole thymic extracts of SPLF and SPLDCKO mice. GAPDH antibody was used as a loading control. (C) Immunofluorescence was performed on frozen thymic sections from SPLF and SPLDCKO mice using CD11c, SPL antibody, and DAPI (blue) to stain the nuclei. Bar, 100 µm. The results shown are representative of three thymuses analyzed. (D) Flow cytometric analysis of total thymocytes in representative SPLF and SPLDCKO mice. (E) Flow cytometric analysis of CD4SP thymocytes. Mature CD4SP cells were gated as CD62LHiCD69Lo in representative SPLF and SPLDCKO. (D and E) Numbers indicate percentage of cells in the indicated gate. (F) Absolute numbers of CD4SP and CD8SP SPLF and SPLDCKO mice corresponding to the dot plot shown in D, summarized in graph format (CD4SP: SPLF, n = 15; SPLDCKO, n = 18. CD8SP: n = 8/group). (G) Absolute numbers of mature CD4SP and mature CD8SP T cells from SPLF and SPLDCKO mice corresponding to the dot plot shown in E, summarized in bar graph format (Mature CD4: SPLF, n = 15; SPLDCKO, n = 18. Mature CD8: n = 8/group). (H) Absolute numbers of CD4+ and CD8+ T cells in the spleen, blood, mesenteric LN, and lymph fluid (lymph) of SPLF and SPLDCKO as indicated (SPLF, n = 7; SPLDCKO, n = 15). (F–H) Graphs represent a compilation of five independent experiments. (I) S1P1 surface abundance on mature CD4SP T cells in representative SPLF and SPLDCKO mice. The gray histogram shows a negative isotype control. (J) Quantification of mean fluorescence intensity (MFI) of S1P1 (SPLF, n = 4; SPLDCKO, n = 4). The results shown are representative of two experiments. (F–H and J) Mean values ± SD are shown. *, P < 0.05; **, P < 0.01; ***, P ≤ 0.001; ****, P < 0.0001 for two-tailed unpaired Student’s t tests between SPLF and SPLDCKO.

