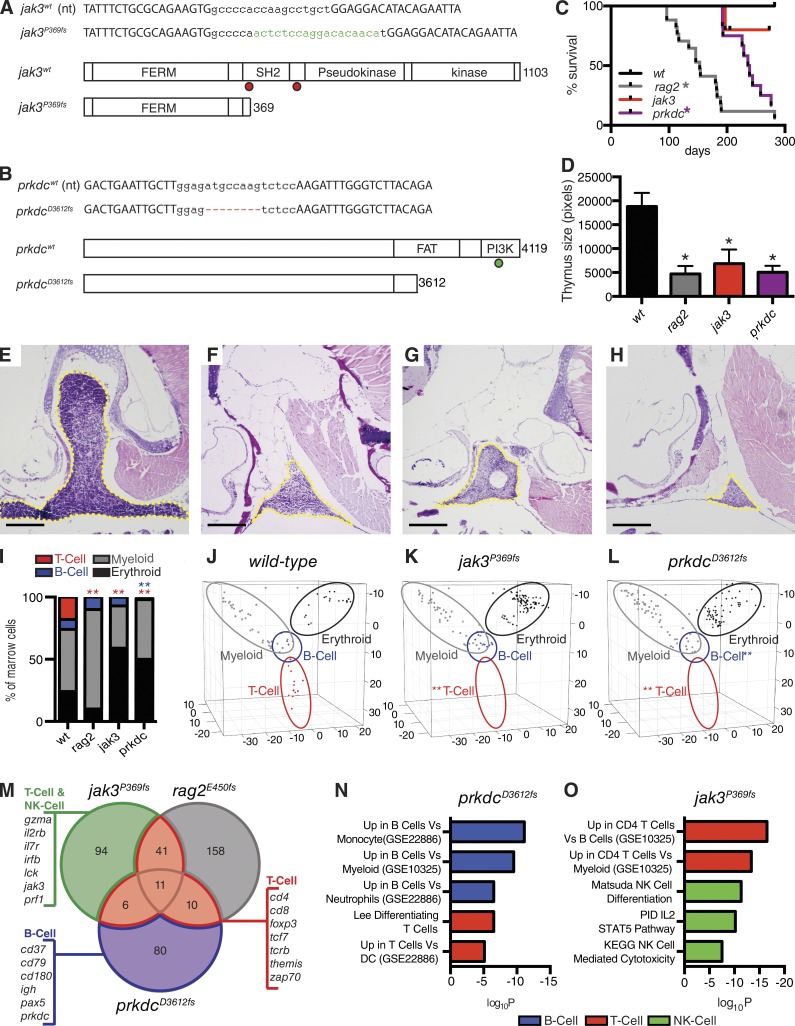
Figure 1.
Characterization of rag2E450fs, jak3P369fs, and prkdcD3612fs mutant zebrafish. (A and B) Genetic mutations created for jak3 and prkdc. Capital letters show TALEN-binding sites. Green lowercase letters denote additions and red hyphens represent deletions. Dots indicate truncation mutations found in human (red) and mouse (green) SCID. (C) Kaplan-Meier survival analysis for wild-type and mutant zebrafish lines (rag2E450fs, n = 17; jak3P369fs, n = 12; prkdcD3612fs, n = 12; casper wild-type, n = 12; *, P < 0.0001 survival compared with wild-type survival, Log-rank test). (D) Quantification of thymus size in mutant and wild-type fish (*, P < 0.028, Student’s t test; n ≥ 5 animals per group analyzed). (E–H) Hematoxylin and eosin–stained sections of thymus from 90-d-old wild-type (E), rag2E450fs (F), jak3P369fs (G), and prkdcD3612fs (H) mutant zebrafish; yellow dashed lines denote thymus (n ≥ 5 animals per group analyzed). Bars, 25 µm. (I–L) Quantization of blood cells contained in the marrow as assessed by Fluidigm single-cell quantitative PCR (I) and visualized by principle component analysis (J–L). Significant reductions in T cells are denoted by red asterisks (P = 0.0001) and B cells by blue asterisk (P = 0.001; Fisher’s exact test, n = 72, 138, and 145 cells analyzed in wild-type, jak3P369fs, and prkdcD3612fs mutant fish, respectively; cells were combined from the marrow of two fish in each analysis). Blood cell lineages are denoted by open ovals in J–L. (M) Venn diagram showing overlap of selected down-regulated genes identified after RNA sequencing of the whole kidney marrow of jak3P369fs, prkdcD3612fs, and rag2E450fs mutants (n = 3 fish analyzed/genotype). Gene expression is relative to wild-type marrow (>2-fold change; FDR < 0.05, Benjamini-Hochberg test). (N and O) Molecular pathways down-regulated in prkdcD3612fs (N) and jak3P369fs (O) mutant marrow.GSEAsig FDR ≤ 6.33 × 10⁻⁴ for each analysis.

