Figure 3.
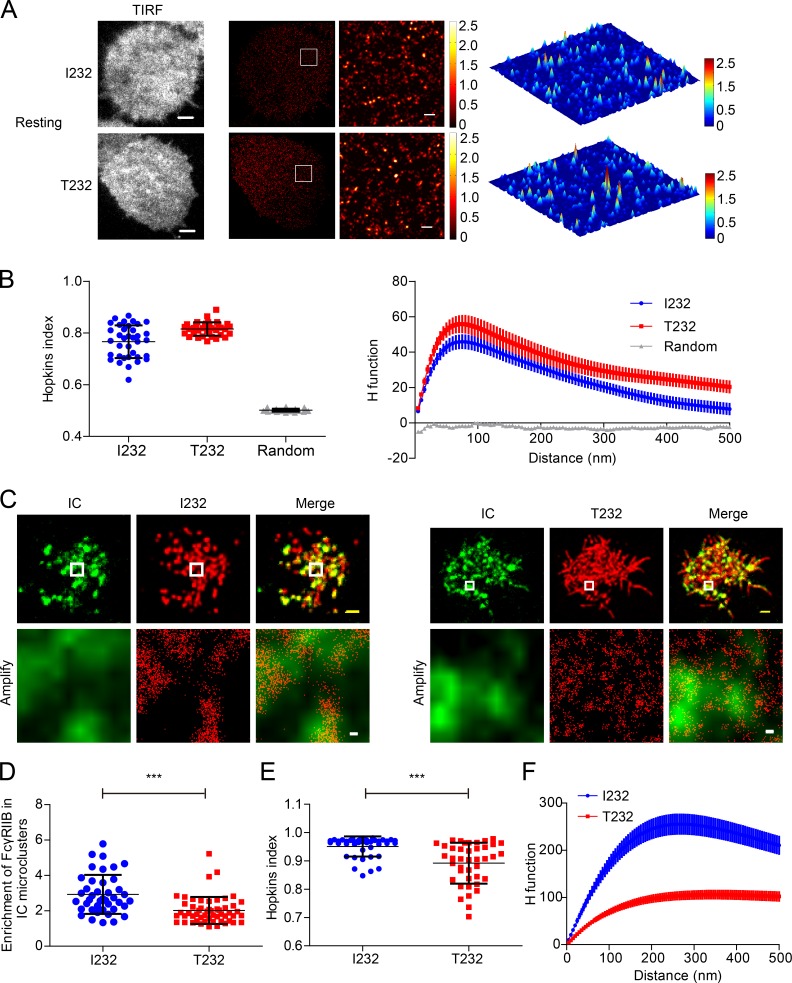
FcγRIIB-T232 is less enriched in IC microclusters in recognition of ICs. (A) A20II1.6 B cell expressing Eos3.2-tagged FcγRIIB-I232 or FcγRIIB-T232 was placed on antigen-free PLBs. Cells were then fixed, imaged, and processed for PALM imaging. (Left) TIRF images. (Middle) PALM images of the same representative cell. (Right) An inset region in the white squares in the PALM images is also shown as a 3D surface plot. Bars: (TIRF image), 3 µm; (superresolution) 300 nm. (B) Given is the quantification of the distribution of FcγRIIB-I232 and FcγRIIB-T232 by Hopkins index (left) and H function (right). Data were pooled from two experiments with a minimum of 14 cells per experiment. Bars represent mean ± SD in Hopkins index (left) and mean ± SEM in H function (right). (C) Similarly as in A, Eos3.2-tagged FcγRIIB-I232 (left)- or FcγRIIB-T232 (right)-expressing B cells were placed on PLBs presenting 20 nM Alexa Fluor 647–conjugated goat IgG anti–mouse Igκ. (Top) Images are conventional TIRF images of IC microclusters and superresolution images of FcγRIIB-I232 (left) or FcγRIIB-T232 (right). Bars, 1.5 µm. (Bottom) Images are the insets in the white squares. Bars, 50 nm. (D) Enrichment of FcγRIIB-I232 and FcγRIIB-T232 molecules within IC microclusters. Data are pooled from at least two independent experiments with a minimum of 12 cells per experiment. Bars represent mean ± SD. A Student's t test was performed with the p-value indicated. (E and F) Given is the quantification of the distribution of FcγRIIB-I232 and FcγRIIB-T232 by Hopkins index (E) and H function (F). Data were pooled from at least two independent experiments with a minimum of 12 cells per experiment. Bars represent mean ± SD (E) or mean ± SEM (F). ***, P < 0.0001.

