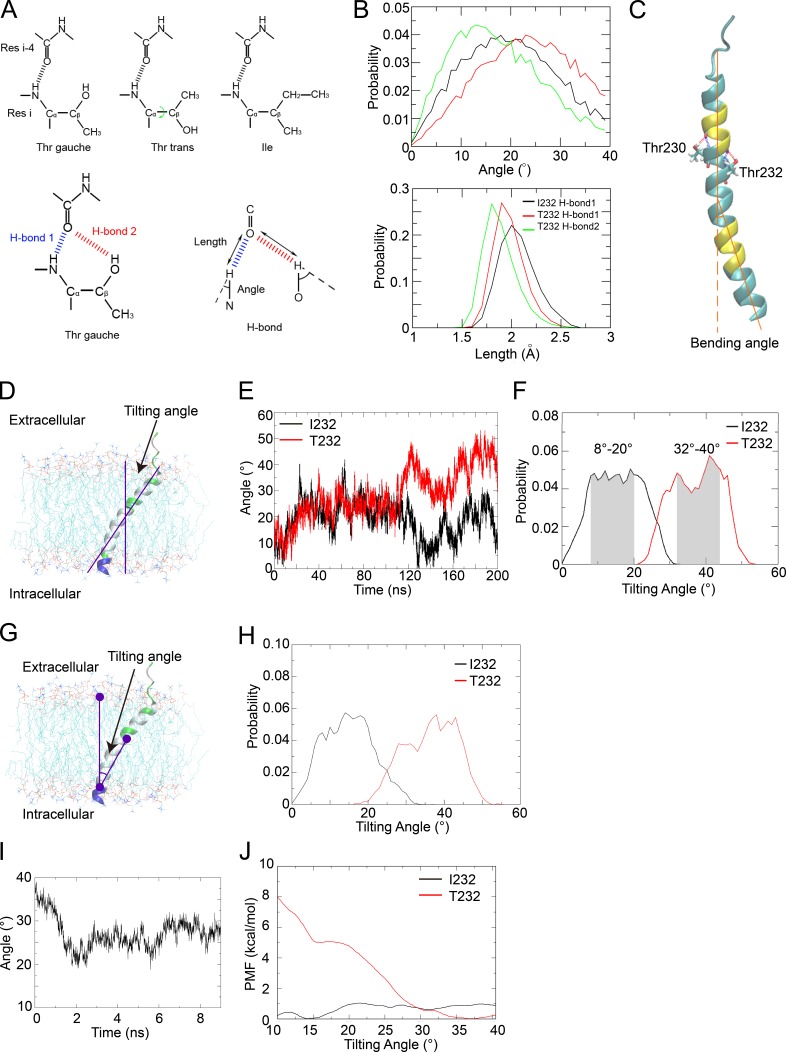
Figure 6.
The FcγRIIB-T232 TM helix becomes more bent and prefers a more tilted orientation in the lipid membrane. (A, top) The χ1 angle in the side chain of Thr232 can take either gauche or trans conformations. (Bottom, left) For Thr232, the bifurcated hydrogen bonds (H-bond 1 and H-bond 2) can form only when the χ1 angle takes gauche rather than trans conformation. (Bottom, right) The definitions of the length and angle of the H-bond are illustrated. Res, residue. (B) Comparison of the probability distributions of the angle (top) and length (bottom) of H-bond 1 in the FcγRIIB-I232 (black) and FcγRIIB-T232 (red) systems and H-bond 2 in the FcγRIIB-T232 (green) system. (C) Illustration of the helix bending caused by Thr residues (Thr230 and Thr232 shown in the Licorice representation). The bending angle was estimated by the scalar angle between two vectors representing the directions of both termini of the helix. The terminal residues used to calculate the vectors are colored in yellow. (D) The tilting angle was estimated by the scalar angle between the direction axis of the helix (estimated using the yellow residues) and the norm of the membrane (estimated using the phosphorus atoms). (E) The time series of the tilting angles of the TM helix in 200-ns simulations of the FcγRIIB-I232 (black) and FcγRIIB-T232 (red) systems. (F) Probability distributions of the tilting angles estimated from the last 80 ns in the simulations on the FcγRIIB-I232 (black) and FcγRIIB-T232 (red) TM helices. The favored intervals for the tilting angles are highlighted in shadow. (G and H) Probability distributions of tilting angles (H) estimated using an alternative mathematical method (G), as the scalar angle between the center of phosphorus atoms in the upper lipid leaflet, the center of carbonyl carbon atoms in residues 244–247 that represent the C terminus of the TM helix, and the center of all Cα atoms in residues 224–245 that represent the geometric center of the TM helix. (I) Tilting-angle relaxation of the FcγRIIB TM helix after backward T232I substitution. (J) The free energy profiles against the tilting angle in the FcγRIIB-I232 (black) and FcγRIIB-T232 (red) systems. (A–J) All the MD results have been verified in three independent experiments, using different force fields and different lipid composition. See also Fig. S1 and Videos 7 and 8.

