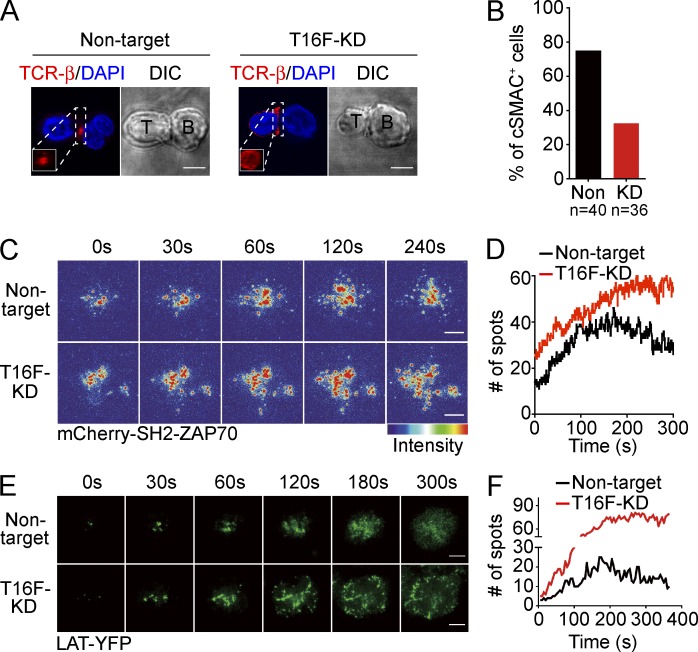
Figure 10.
Impaired cSMAC formation and sustained TCR signaling in TMEM16F-silenced T cells. (A and B) Confocal microscopy analysis of cSMAC formation by measuring centralized accumulation of TCR-β at the IS between Jurkat T cells and SEE-pulsed Raji B cells. Percentage of cSMAC-positive cells is shown in B. Insets are 3D reconstructions of the IS en face. Non, control; KD, TMEM16F-knockdown. DIC, differential interference contrast. (C and D) Nontarget or T16F-KD Jurkat cells expressing mCherry-tSH2-ZAP70 were stimulated on αCD3-coated coverslips. Dynamics of mCherry-tSH2-ZAP70 at the TCR activation site were imaged by TIRF microscopy. SH2 domain of ZAP70 specifically binds to phosphorylated tyrosine residues in the CD3 signaling units of TCRs. Signal from the phosphotyrosine probe is depicted as thermal intensity in C. Number of mCherry-tSH2-ZAP70–positive spots were quantified in D. (E and F) Dynamics of LAT microclusters at the TCR activation site were imaged by TIRF microscopy. Number of LAT microclusters is quantified in F. Bars, 5 µm. Data are representative of three experiments.

