Figure 3.
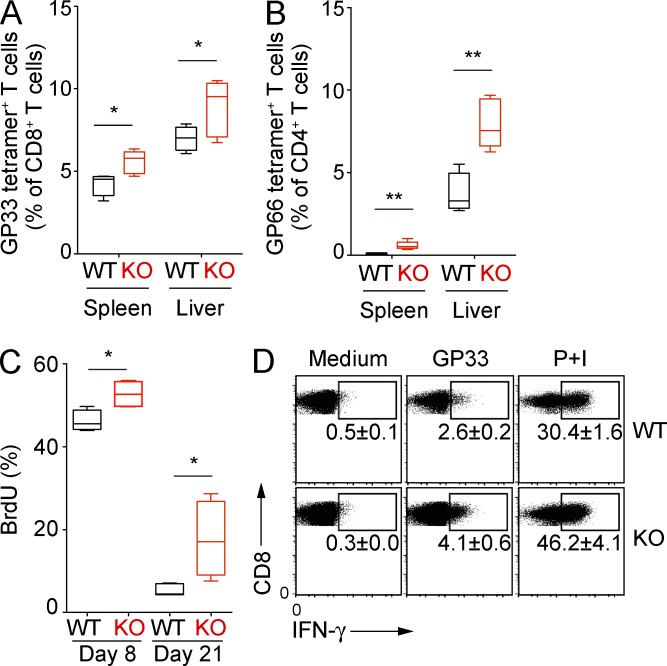
Increased T cell activation in TMEM16F-KO mice during early phase of chronic infection. (A–D) WT or TMEM16F-KO mice were i.v. infected with 4 × 10⁶ pfu LCMV clone 13. T cell responses were analyzed on day 6 after infection (A, B, and D) and day 21 after infection (C). (A and B) Frequencies of GP33-tetramer–positive cells among total CD8 T cells in A, and GP66-tetramer–positive cells among total CD4 T cells in B were determined by flow cytometry. n = 4 for WT and n = 5 for KO. (C) Proliferation of GP33-tetramer–positive T cells from spleen was measured by BrdU incorporation at indicated time points after infection. n = 4, 4, 5, and 4, from left to right. (D) Flow cytometry analysis of intracellular IFN-γ production in CD8 T cells in response to GP33, or PMA and Ionomycin (P+I). n = 4 for WT; n = 5 for KO. Results are displayed as mean ± SEM of two independent experiments. *, P < 0.05; **, P < 0.01; ns, not significant, using Student’s t test.

