Figure 6.
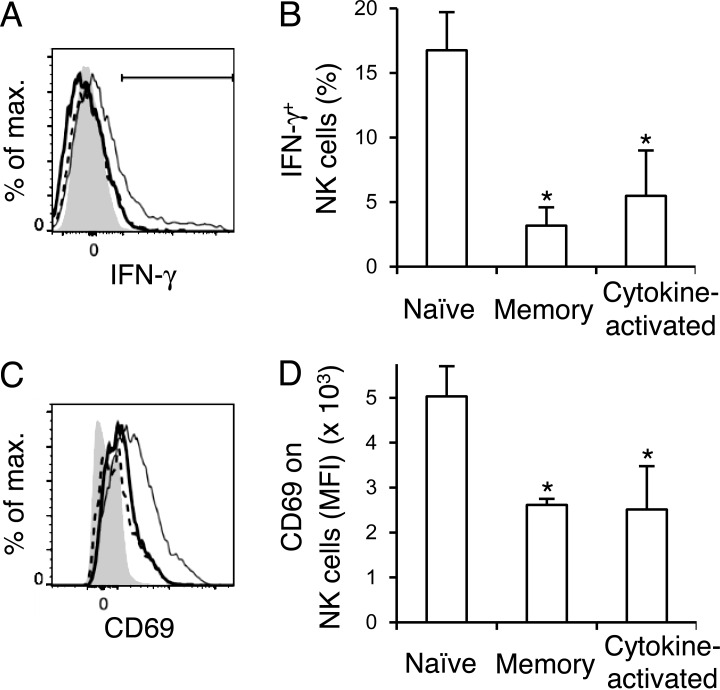
Memory NK cells and cytokine-activated NK cells show diminished responses to L. monocytogenes infection. NKp46-CreERT2 Tg mice with homozygous Rosa26-YFP alleles were treated with tamoxifen on days 0–4 and infected or not with MCMV on day 0. On day 25, these mice were infected intravenously with 5 × 10⁴ CFU L. monocytogenes, and YFP+ NK cells in naive MCMV-uninfected mice and YFP+Ly49H+KLRG1high memory NK cells and cytokine-activated YFP+Ly49H−KLRG1high NK cells in MCMV-infected were analyzed on day 1.5 after infection with L. monocytogenes. (A) IFN-γ+ in naive NK cells, memory NK cells, and cytokine-activated NK cells in the spleens of L. monocytogenes–infected mice. Bold solid lines, bold dashed lines, and thin lines represent memory NK cells, cytokine-activated NK cells, and naive NK cells, respectively. A filled histogram represents NK cells in naive uninfected mice. The percentages of IFN-γ+ NK cells are quantified in B. (C) CD69 on naive NK cells, memory NK cells, and cytokine-activated NK cells in the spleens of L. monocytogenes–infected mice. Bold solid lines, bold dashed lines, and thin lines represent memory NK cells, cytokine-activated NK cells, and naive NK cells, respectively. A filled histogram represents staining with an isotype-matched control Ig. MFI of CD69 staining of NK cells is shown in D. Data were representative of two experiments (n = 4 in each experiment) in A and C. Data were pooled from two experiments (n = 4 in each group) in B and D. *, P < 0.05 versus naive cells. P-values were calculated by a Student’s t test. Error bars show SEM.

