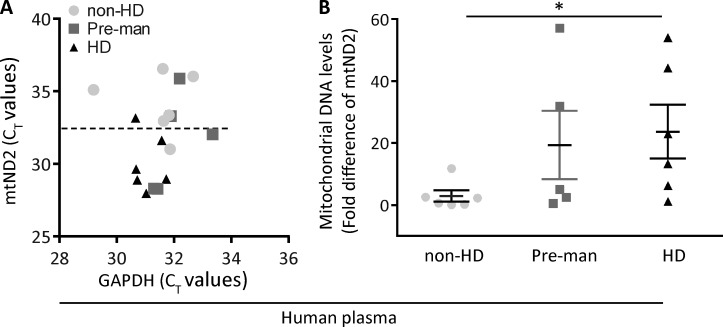
Figure 7.
mtDNA in HD patients and control subjects. (A) Distribution of mtND2 levels in plasma among the groups of human plasma were analyzed by real-time PCR. The scatter plot illustrates the CT values of GAPDH (x axis) against CT values of mtND2 (y axis) in human plasma of non-HD, premanifest (Pre-man), and HD subjects. CT values of mtND2 of HD plasma were lower and clustered below the 50% line compared with premanifest HD and non-HD groups. (B) mtND2 levels were significantly higher in HD plasma versus non-HD plasma (n = 6/non-HD and HD; n = 5/premanifest). Data are presented as mean ± SEM of 2−ΔΔCT. *, P = 0.0415 HD versus non-HD (one-way ANOVA).

