Figure 3.
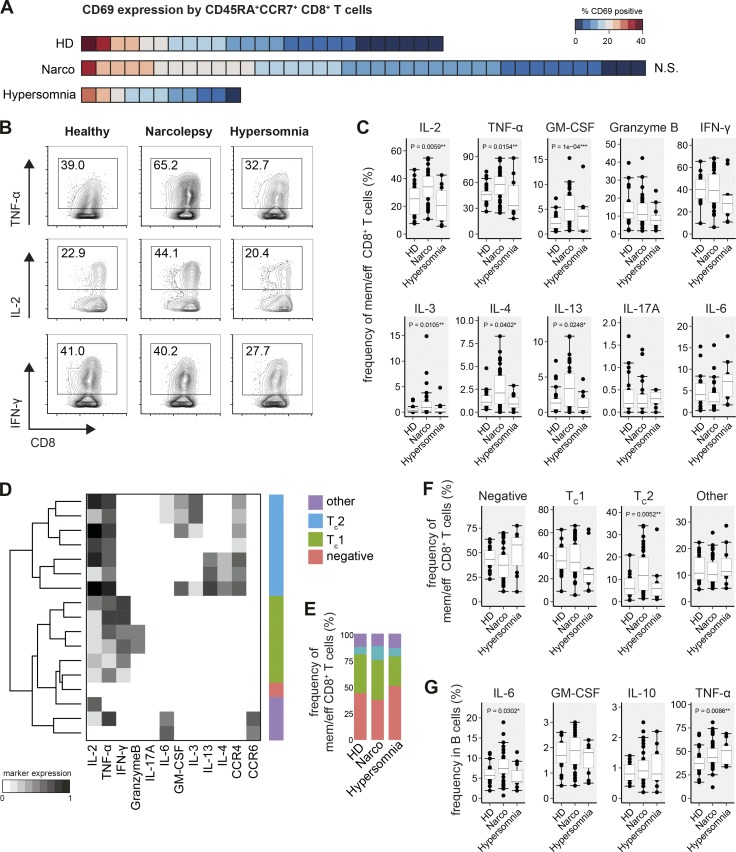
Expansion of B cell-supporting CD8+ T cells in narcolepsy. FlowSOM-defined CD8+ T cells of narcolepsy patients (Narco, n = 39), HD (n = 25), and patients with other hypersomnias (n = 11) were examined for CD69 expression and cytokine production. (A) Heat map depiction of the frequency of CD69+ cells in CD45RA+CCR7+ CD8+ T cells was sorted from highest to lowest frequency for all narcolepsy patients and controls. Each square represents one individual. (B) Manually determined frequencies of cytokine+ antigen-experienced (effector, effector memory, and central memory) CD8+ T cells and (C) statistical comparison of the frequencies of cytokine+ cells. (D) FlowSOM (k = 17) was used to cluster antigen-experienced CD8+ T cells based on their cytokine-production profiles. The major CD8+ T subsets were manually annotated using these cytokine production profiles in combination with their CCR expression. (E) Group-specific composition and (F) statistical comparison of the frequencies of CD8+ T cell subsets in narcolepsy patients and controls. (G) Manually gated frequencies of cytokine+ B cells. Boxplots represent the IQR with a black horizontal line indicating the median. Whiskers extend to the farthest data point within a maximum of 1.5× IQR. Values outside this range are plotted as points. All p-values were calculated using a nonparametric Mann-Whitney-Wilcoxon test and compare narcolepsy patients with HD. Controlling for multiple comparisons was performed with the Benjamini-Hochberg approach. *, significant with FDR < 10%; **, significant with FDR < 5%; ***, significant with FDR < 1%.

