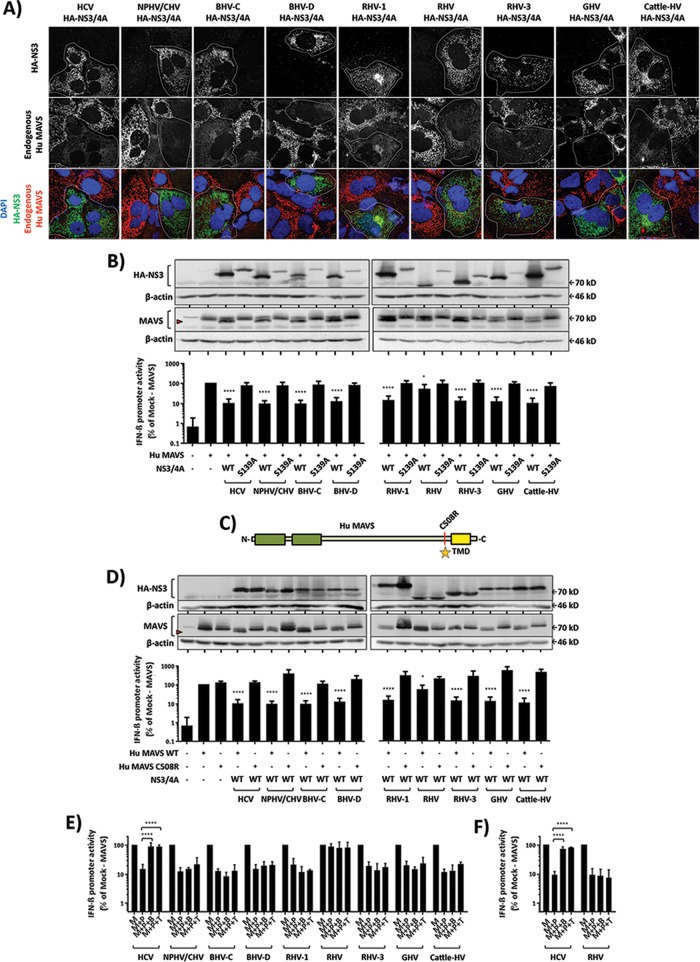
FIG 4.
Nonhuman hepaciviral NS3/4A proteases cleave and inhibit signaling of human MAVS. (A) Localization and expression of endogenous Hu MAVS in Huh7-Lunet hCD81 cells are influenced by the presence of a nonhuman hepaciviral NS3/4A protease. The cells were transduced with lentiviral pseudoparticles (PP) harboring the indicated HA-tagged NS3/4A constructs. The expression of HCV NS3/4A (1st column) serves as a comparison control. Dotted white lines outline HA-positive (NS3/4A-expressing) cells. The confocal immunofluorescence analysis was conducted using HA-tag- and Hu MAVS-specific antibodies. (B) Effects of wild-type (WT) and S139A mutant nonhuman hepaciviral NS3/4A proteases on Hu MAVS expression (upper panels) and downstream MAVS-dependent signaling to the IFN-β promoter (lower panels). HEK 293T MAVS−/− cells were transfected with the indicated expression constructs or mock transfected. Subsequently, protein expression was monitored by Western blotting using HA-, actin-, and Hu MAVS-specific antibodies. IFN-β promoter activity was quantified using luciferase assays. (C) Diagram illustrating wild-type or C508R mutant human MAVS. (D) Effects of wild-type (WT) nonhuman hepaciviral NS3/4A proteases on wild-type or C508R mutant Hu MAVS expression (upper panels) and downstream MAVS-dependent IFN-β promoter activity (lower panels). HCV NS3/4A expression serves as a comparison control. Red arrowheads in WB panels indicate MAVS cleavage products. (E and F) Effects of HCV protease inhibitors (boceprevir [B] or telaprevir [T]) against the indicated hepaciviral proteases (P). Either Hu MAVS (E) or Mu MAVS (F) was used as the protease substrate. The expression of MAVS (M) in the absence of protease served as an untreated control. Each drug was given at a final dose of 2.5 μM. WB analyses and MAVS-dependent IFN-β promoter reporter assays were done as explained in Materials and Methods. WB images are representative of at least two individual experiments, and all graphical data are shown as means ± SD for at least three independent experiments.

