FIG 3.
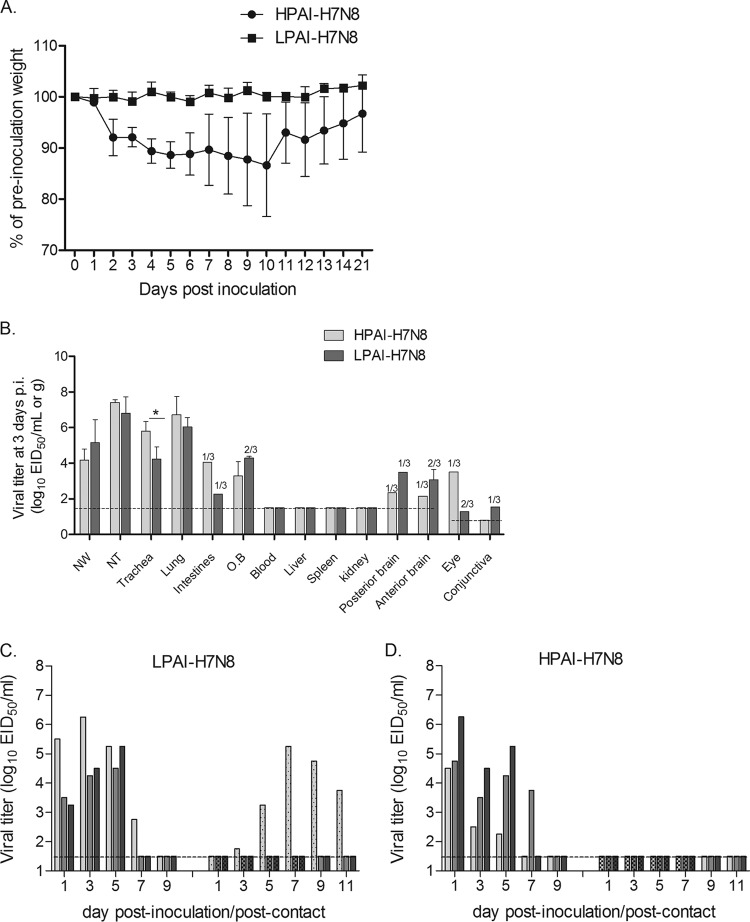
H7N8 virus pathogenesis and transmission in ferrets. (A) Three ferrets inoculated i.n. with 106.0 EID50 of either HPAI or LPAI H7N8 virus were monitored for weight loss until 21 days p.i. The mean percentages of preinoculation weight of ferrets are shown. (B) Three infected ferrets were euthanized on day 3 p.i., and nasal wash samples (NW) and tissue samples, including nasal turbinates (NT), trachea, lung, intestine, olfactory bulb (OB), blood, liver, spleen, kidney, posterior brain, anterior brain, eye (pooled left and right), and conjunctiva (pooled left and right), were collected for viral titration in eggs. Mean viral titers + SD are expressed as log10 EID50/ml (for NW and NT samples) or log10 EID50/g. If virus was not detected in 100% of any particular tissue samples, the number of positive samples out of the total number is shown on top of the bar graph. (C, D) Three naive contact ferrets were cohoused with LPAI (C) or HPAI (D) H7N8 virus-infected ferrets, and nasal wash samples were collected for viral titration on the indicated days p.i. or p.c. Viral titers in nasal wash samples from each of three individual inoculated ferrets (solid bars, left) and contact ferrets (dotted/checkered bars, right) are expressed as log10 EID50/ml. The dashed horizontal lines indicate the detection limit of 1.5 log10 EID50/ml or log10 EID50/g for NW or most tissue samples, except for eye and conjunctiva samples, which have a detection limit of 0.8 log10 EID50/ml. Statistical analysis was performed using two-way ANOVA with GraphPad Prism if all three samples from same groups were virus positive. *, P < 0.05.

