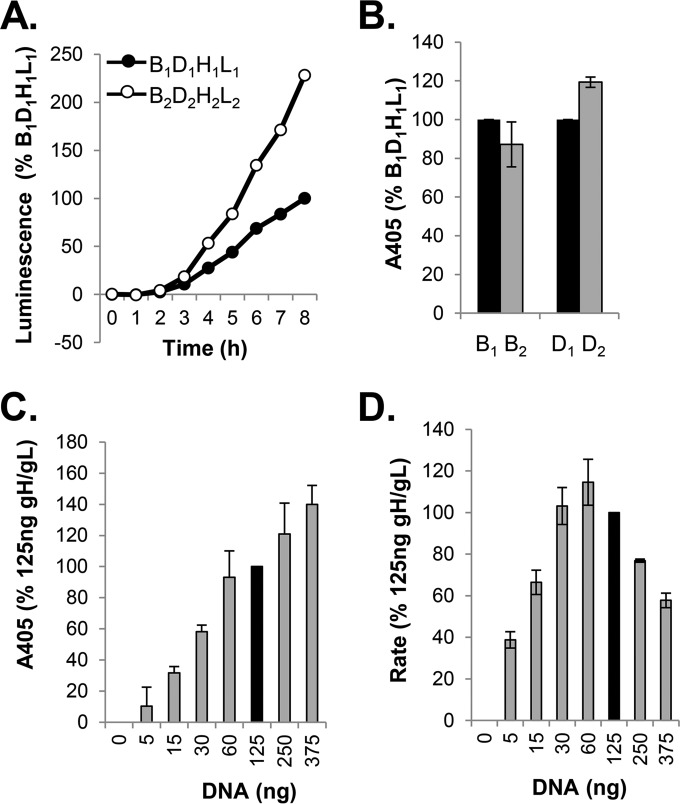
FIG 1.
Split luciferase assay (SLA) and surface expression of all-HSV-1 (all type 1) versus all-HSV-2 (all type 2) glycoproteins. (A) Kinetics of fusion. Cells were transfected with B1D1H1L1 or B2D2 H2 L2, and the rate of fusion was determined by SLA. Data are normalized to the results for all type 1 glycoproteins. (B) Results of CELISA. Cells transfected with all type 1 or all type 2 constructs were used to determine surface expression of gB1 and gB2 (R68 PAb); replica wells were used to determine the expression of gD1 and gD2 (R7 PAb). (C) Surface expression of gH2/gL2 (CELISA). Cells were transfected with various amounts of gH2/gL2 DNA, while DNA of the other two glycoproteins was maintained at 125 ng. The overall DNA concentration in all samples was maintained constant by using pCAGGS empty vector. Data were normalized to the expression of gH2/gL2 when cells were transfected with 125 ng of gH2/gL2 DNA (black bar). (D) Rate of fusion as a function of gH2/gL2 DNA concentration. Cells were transfected as described for panel C. Fusion was monitored for 8 h. Data were normalized to fusion levels measured when cells were transfected with 125 ng of gH2/gL2 DNA (black bar).

