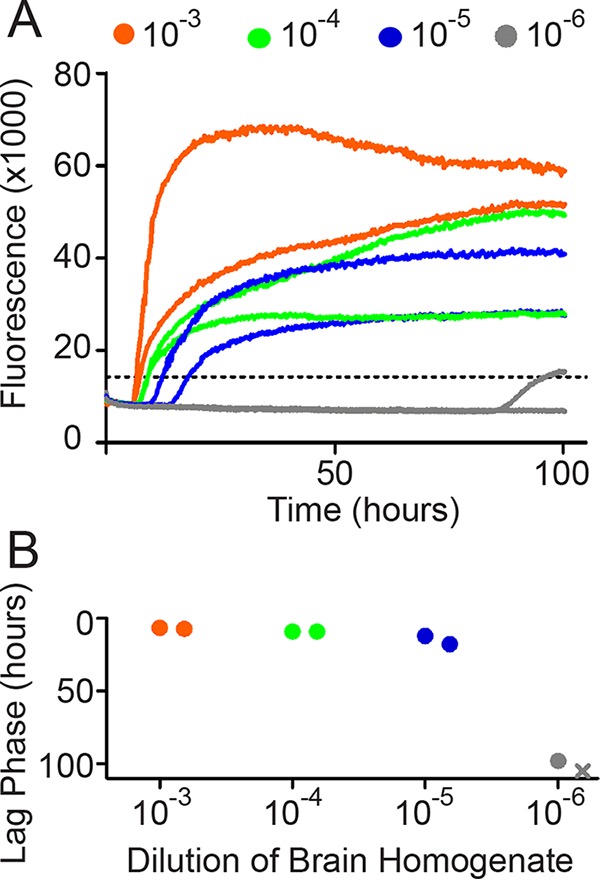
FIG 1.

Data analysis workflow. (A) Raw data are recorded as fluorescence every 15 min. We show two technical replicates for this example. (B) We plot the time required to reach the threshold (+5 SD above the mean background) versus the dilution of 10% brain homogenate added to the reaction mixture. The X indicates an estimated value for a sample that did not cross the threshold during the experiment. We have reversed the y axis to make it easier to identify the fastest conversions as the highest points.
