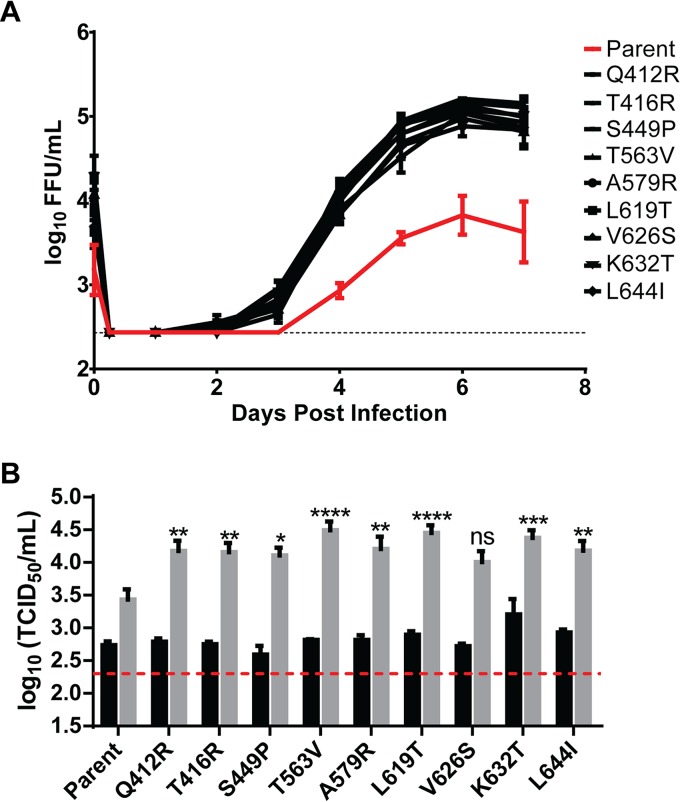
FIG 2.
Growth kinetics of viruses bearing the dominant mutations identified by serial passage of E2 mutant pools. (A) Huh7.5 cells were infected with each of the nine mutants selected for study and parent virus at an MOI of 0.1 based on titers calculated using the TCID50 method. Input virus was removed 6 h after infection, and samples were collected every 24 h for 7 days. Supernatant viral titers were analyzed by FFA. (B) Cultures of Huh7.5 cells were infected as described for panel A at an MOI of 0.05. Inoculum (black bars) and titers of virus from supernatant at day 5 (gray bars) were determined using the TCID50 method. Error bars represent standard errors of the means (SEM), and dashed lines indicate the limit of detection of the assays. Asterisks indicate differences that are statistically significant (*, P < 0.05; **, P < 0.01; ***, P < 0.001; ****, P < 0.0001; ns, not significant). The results are averages from three independent experiments performed in duplicate.

