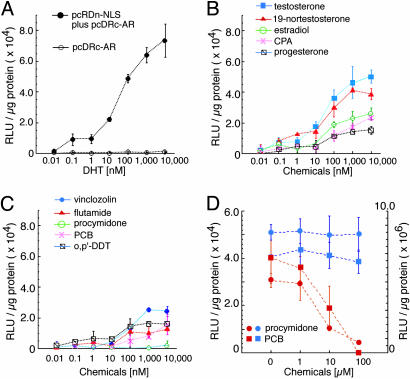
Fig. 3.
Quantitative analysis of AR translocation for various chemical compounds. (A) Dose–response curves for DHT based on the luminescence intensity of the reconstituted Rluc. The COS-7 cells were transiently transfected with pcDRc-AR or cotransfected with pcRDn-NLS and pcDRc-AR, and Rluc activities were tested. The mean luminescence intensities (n = 3) were determined at each DHT concentration. (B) Dose–response curves for steroid hormones based on the luminescence intensity of Rluc. The COS-7 cells were cotransfected with pcRDn-NLS and pcDRc-AR, and Rluc activities were tested upon addition of each hormone (n = 3). (C) Dose–response curves for synthetic chemical compounds based on the luminescence intensity of Rluc. (D) An inhibitory effect of procymidone or PCB on the bioluminescence developed by 0.1 μM DHT. Red dotted curves were obtained from the cells cotransfected with pcRDn-NLS and pcDRc-AR, whereas blue dotted curves were from the cells with pcRDn-NLS and pcDRc-NLS (positive control, n = 3). The circles and squares are the means of luminescence intensities obtained from the cotransfected cells stimulated with procymidone and PCB, respectively. Left and right y axes are for red and blue dotted lines, respectively.

