FIG 7.
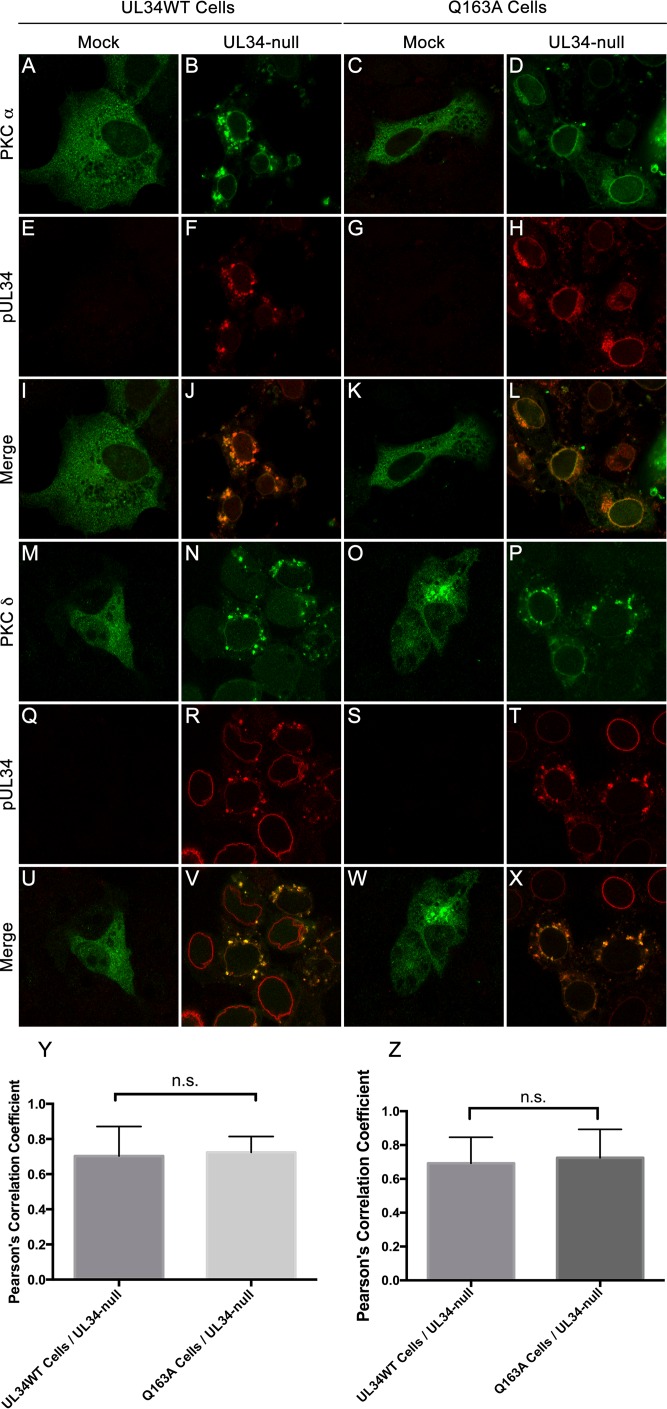
PKCα and PKCδ are recruited to sites containing UL34(Q163A). (A to L) Confocal images of PKCα and pUL34 in infected and uninfected cells. UL34WT-expressing cells (A, B, E, F, I, and J) and Q163A-expressing cells (C, D, G, H, K, and L) were transfected with an HA-PKCα overexpression construct and subsequently infected with no virus (A, C, E, G, I, and K) or the UL34-null virus (B, D, F, H, J, and L). Cells were fixed at 16 hpi and stained for HA-PKCα (A to D) or pUL34 (E to H). (M to X) Representative confocal images of PKCδ and pUL34 in infected and uninfected cells. UL34WT-expressing cells (M, N, Q, R, U, and V) and Q163A-expressing cells (O, P, S, T, W, and X) were transfected with MYC-tagged PKCδ and subsequently infected with no virus (M, O, Q, S, U, and W) or the UL34-null virus (N, P, R, T, V, and X). (Y) Colocalization of HA-PKCα and pUL34 was determined by calculating Pearson's correlation coefficient. Statistical significance was determined by one-way analysis of variance (ANOVA). (Z) Colocalization of PKCδ and UL34 was determined by calculating Pearson's correlation coefficient. Statistical significance was determined by one-way ANOVA. n.s., not significant.

