
FIG 3.
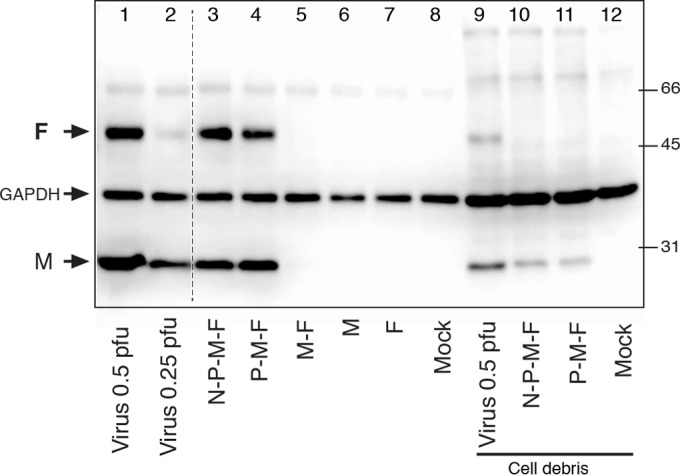
Relative F protein levels in VLPs versus wt virions. HEp-2 cells were infected with wt virus at 0.5 or 0.25 PFU/cell or transfected as for Fig. 2 with various plasmid combinations. Cell surface-associated VLPs and wt viruses were harvested as described in the text at 24 hpt or 22 hpi, respectively. Western blots were generated and incubated with anti-M, anti-F, and anti-GAPDH antibodies. Protein levels were quantitated using a Li-Cor scanner and Image Studio software. Lanes 1 to 8, particle yields from ∼300,000 cells; lanes 9 to 12, non-VLP fraction (cell debris) at ∼12,000 cells/lane. The relative protein amounts were determined, and the F/M ratio was calculated (see Materials and Methods). The positions of M, F, and GAPDH and the molecular weights of biotinylated protein markers (on the right) are indicated in thousands. The dashed line between lanes 2 and 3 indicates where two lanes containing samples not relevant to the experiment were removed.