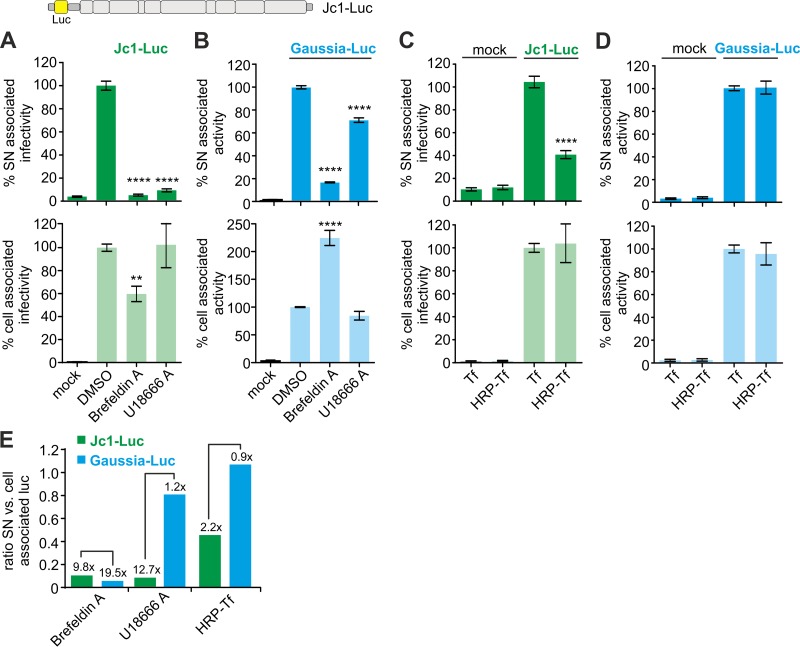
FIG 8.
HCV but not Gaussia luciferase (Luc) release is suppressed by inhibition of the endosomal compartment. (A) Huh7.5 cells were electroporated with HCV Jc1-luc RNA. At 40 hpe, the medium was changed and fresh medium containing the indicated drugs was added. At an additional 8 h later, supernatants (SN) were harvested and sucrose gradient centrifuged in order to remove the drugs and purify newly produced virus. Pellets were resuspended and used to inoculate uninfected Huh7.5 cells. At 72 h later, cells were lysed and luciferase activity (hence, viral infection) was quantified. The graph shows mean values and standard errors of the means (SEM) of results of four to nine independent electroporation experiments. As shown in the lower panel, we measured Jc1-luc activity in lysates of the producer cells. (B) Same experimental setting as described for panel A; however, Huh7.5 cells were electroporated with a Gaussia luciferase reporter construct. At 8 h later, supernatants were taken and secreted Gaussia luciferase was quantified. The graph shows mean values and SEM of results from six independent electroporations. (C) Huh7.5 cells were electroporated with HCV JC1-luc RNA. At 40 hpe, cells were starved and either transferrin (Tf) or transferrin conjugated with horseradish peroxidase (HRP-Tf) was added and allowed to internalize for 2 h. Subsequently, endosomes were chemically fixed inside living cells as described in Materials and Methods and previously (42, 43). Next, the medium was changed and cells were allowed to produce virus for additional 8 h. Supernatants were taken and sucrose gradient purified and used to inoculate uninfected Huh7.5 cells in order to quantify the amount of released virus. Furthermore, Jc1-luc activity was quantified by measurement of luciferase activity in the producer cells (lower panel). Mean values and SEM from 15 independent electroporation experiments are depicted. (D) Same experimental design as that described for panel C except that a Gaussia luciferase reporter construct was electroporated. Furthermore, the amount of released Gaussia luc was directly quantified in the supernatants. Mean values and SEM from seven independent experiments are shown. Differences were assessed for statistical significance with a one-way ANOVA with posttest. **, P ≤ 0.01; ****, P ≤ 0.0001.

