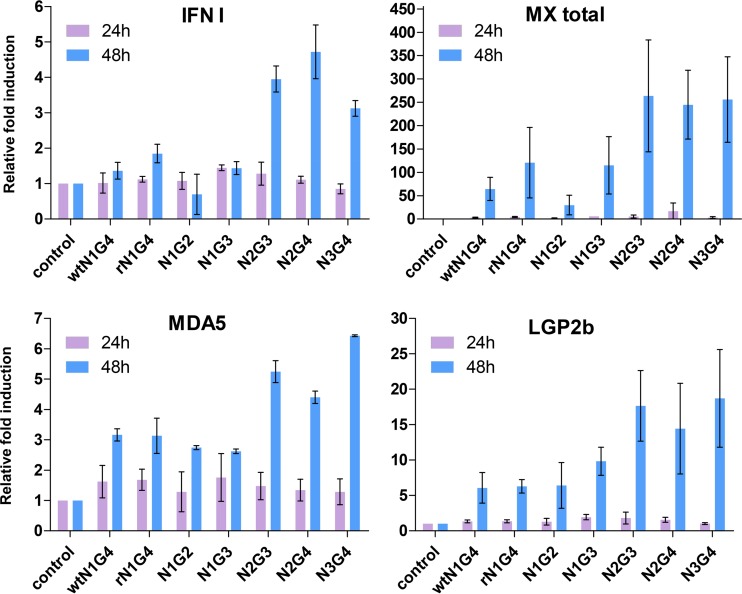
FIG 5.
Level of transcription of genes related to the IFN response in RTG2 cells infected with the different rIHNVs. RTG2 cells were infected with 1 × 10⁵ PFU/ml of the different viruses and incubated for 24 h or 48 h at 14°C. Mock-infected controls were also included. The levels of transcription of IFN1, total Mx, MDA5, and LGP2b were evaluated through real-time PCR. Transcript levels were calculated relative to that of an endogenous control (EF-1α). Modulated expression was then expressed as fold change, calculated as the mean expression levels in infected cells normalized to that of controls. Means ± SDs of two replicates are shown.

