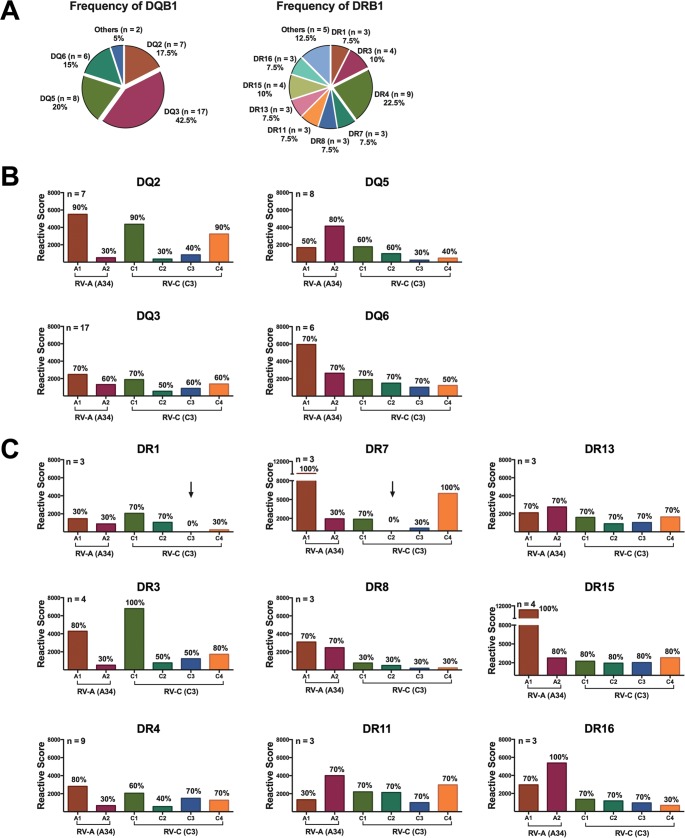
FIG 8.
Analysis of HLA associations. (A) Frequencies of distribution of HLA-DQ and HLA-DR in our cohort of 20 healthy donors. (B and C) Proliferative capacity was measured as the sum of the RS of 20 donors to RV-A and RV-C immunodominant peptides per region, according to HLA-DQ (B) and HLA-DR (C) subgroups. The number of donors in each HLA subgroup is indicated at the top of the y axis of each graph. As the numbers of donors in each HLA subgroup varied, all the subgroups were normalized to an n of 4 for comparison purposes. The arrows indicate regions that failed to induce a proliferative response in vitro. Percentages of responders (donors whose PBMCs proliferated in response to each peptide) are indicated above each bar.

