
Figure 1.
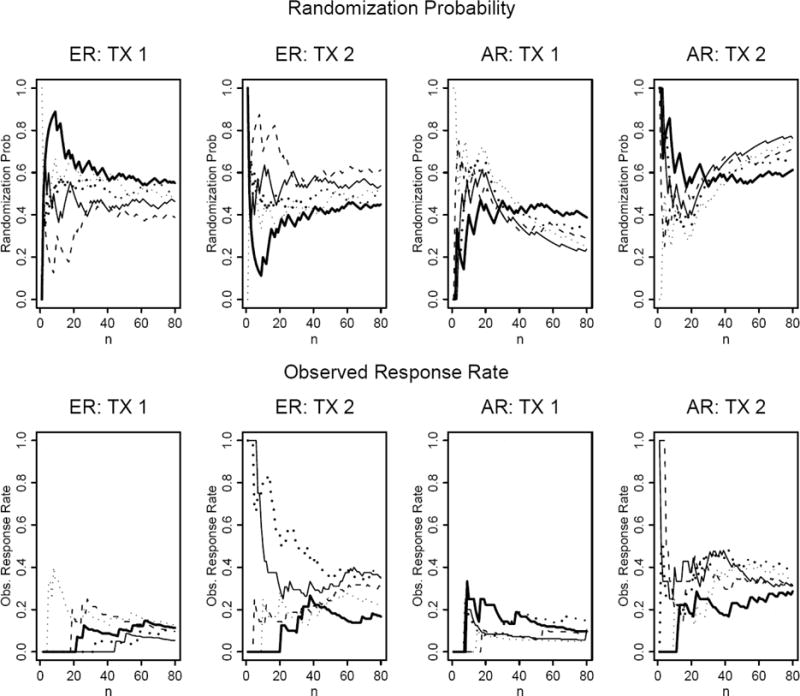
Randomization probability and observed response rate plotted over sequentially enrolled patients under the equal randomization (ER) and adaptive randomization (AR) designs. The probabilities of response in treatment 1 (TX1) and treatment 2(TX2) are 0.1 and 0.3, respectively. For the AR design, AR starts after the first 20 patients are equally randomized.