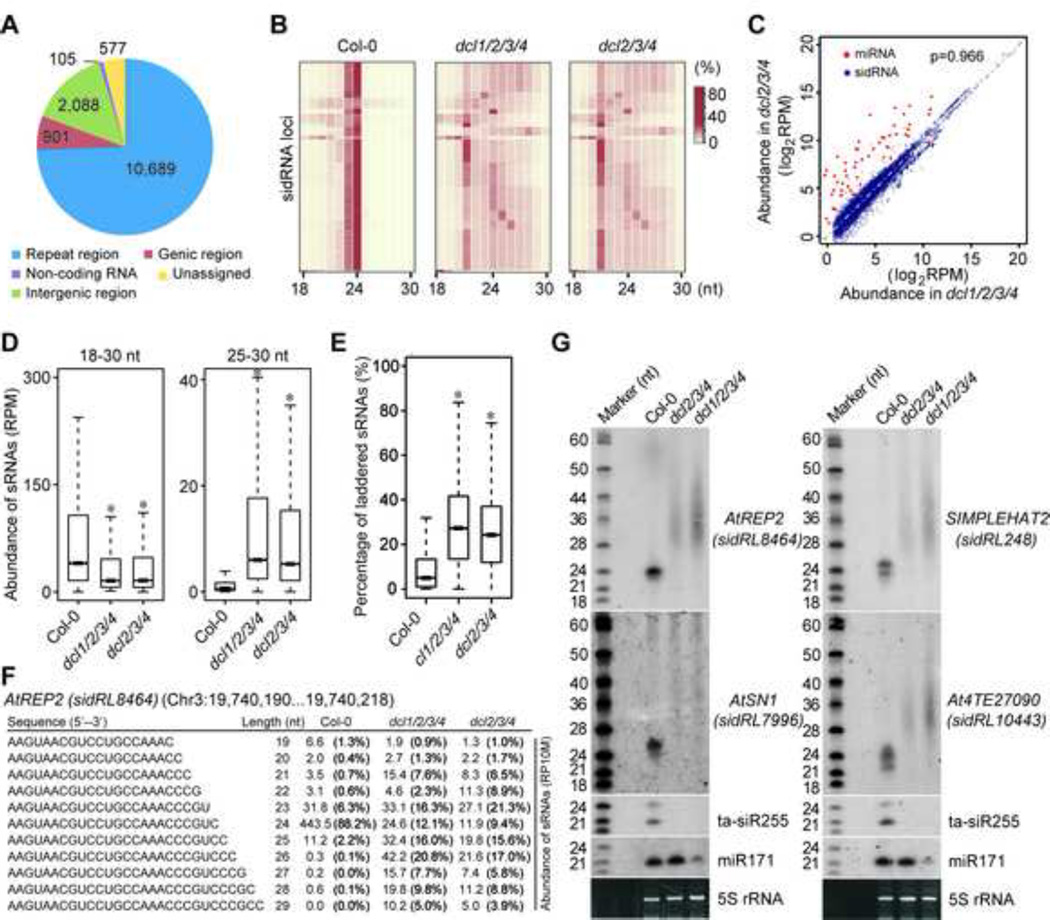
Figure 1. Identification of sidRNAs in Arabidopsis.
(A) Pie chart summarizing the numbers of sidRNA loci in the indicated categories.
(B) Heatmap showing the size distribution of sequenced sRNAs from sidRNA-producing loci in Col-0, dcl2/3/4 and dcl1/2/3/4. Color intensity represents the fraction of sRNAs of different sizes.
(C) Scatter plot showing the abundance (log2RPM) of each miRNA (red) and sidRNA locus (blue) in dcl1/2/3/4 versus that in dcl2/3/4. A reference line of slope=1 is shown. The Spearman’s correlation coefficient (ρ) for sidRNAs in dcl1/2/3/4 and dcl2/3/4 mutants is indicated.
(D) Box plots of levels of sRNAs of the indicated sizes produced from sidRNA loci in Col-0, dcl2/3/4 and dcl1/2/3/4. Asterisks indicate a significant difference between Col-0 and the mutants (P < 10−15, Mann–Whitney U test).
(E) Box plots of the percentages of laddered sRNAs produced from sidRNA loci in Col-0, dcl2/3/4 and dcl1/2/3/4. Asterisks indicate a significant difference between Col-0 and the mutants (P < 10−15, Mann–Whitney U test).
(F) A representative group of laddered sRNAs produced from AtREP2. Numbers represent the abundance (RPM) of sRNAs with different lengths ranging from 19 to 29 nt. Values in the parentheses indicate the percentages of sRNAs with different lengths.
(G) Detection of sRNA production at representative sidRNA loci in the indicated plants by Northern blot. 5S rRNAs stained with ethidium bromide were used as loading controls. A set of 32P-labeled RNA oligos were electrophoresed in parallel and used as size markers. The blots were stripped and re-probed.
See Figures S1, Table S1 and Table S2 for additional information about sidRNA identification in seedling, Figure S2, Figure S3 and Table S4 for information about detection of sidRNAs in other systems.

