
Figure 4.
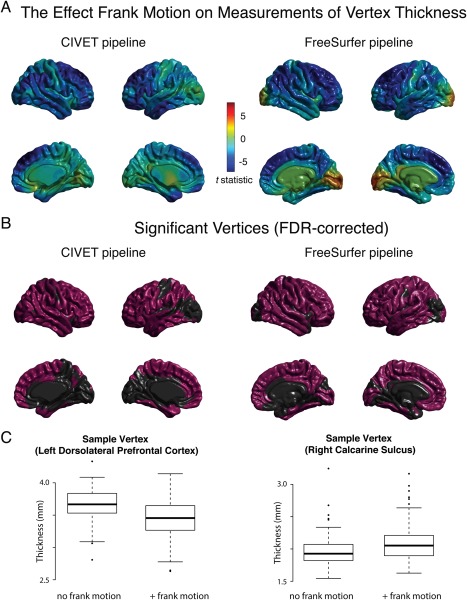
The relationship between frank motion and cortical thickness. ( A) 136 scans visually ranked as Tier 1 (frank motion absent) were gender‐ and age‐matched with 136 scans ranked as Tier 2 (frank motion present) (average age difference between matched scans = ∼1 week). Paired t‐tests were calculated between matched samples, comparing cortical thickness estimated at vertices across the brain the CIVET pipeline (left) and FreeSurfer pipeline (right). (B) Anatomical regions whose relationship with scan quality was statistically significant after FDR‐correction for multiple comparisons. (C) Sample vertices from within the left dorsolateral frontal cortex (CIVET pipeline) and right calcarine sulcus (FreeSurfer pipeline) illustrate the relationship between frank motion and cortical thickness.