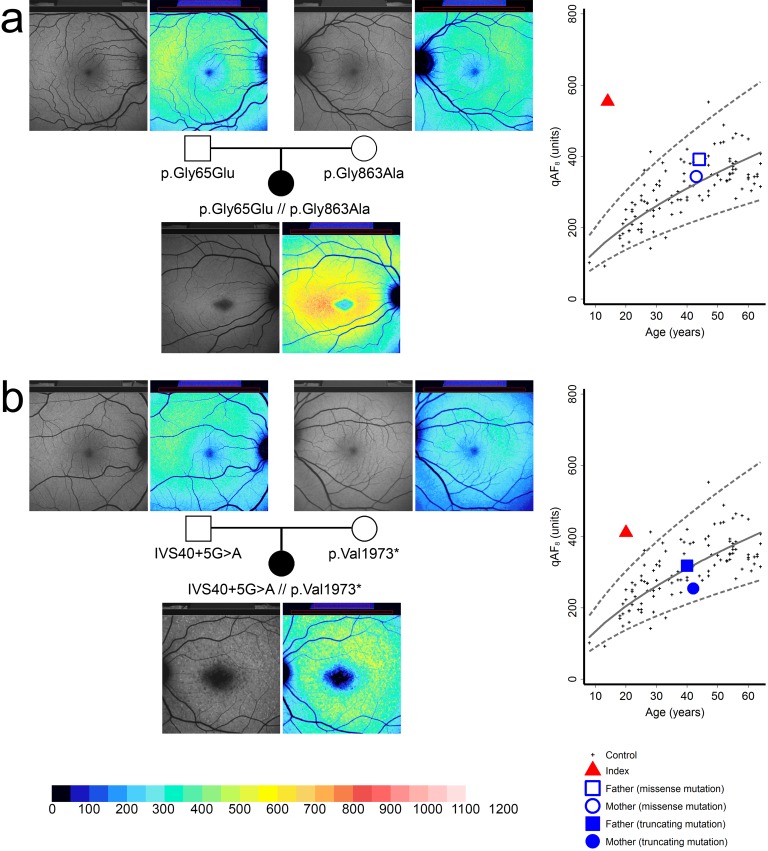
Figure 2.
Quantitative autofluorescence (qAF) in exemplary families with either truncating (a) or missense (b) ABCA4 mutations. Left: Fundus autofluorescence images and corresponding color-coded qAF images in two index patients and their parents ([a] family 10, [b] family 11). Although gray levels appear similar, color-coded images reveal elevated qAF levels in the index patients. Right: Age-dependent qAF8 of the index patients (red triangles) and their parents (blue squares and dots) with monoallelic ABCA4 mutations. Dashed lines: 95% prediction interval of normal controls (black crosses).

