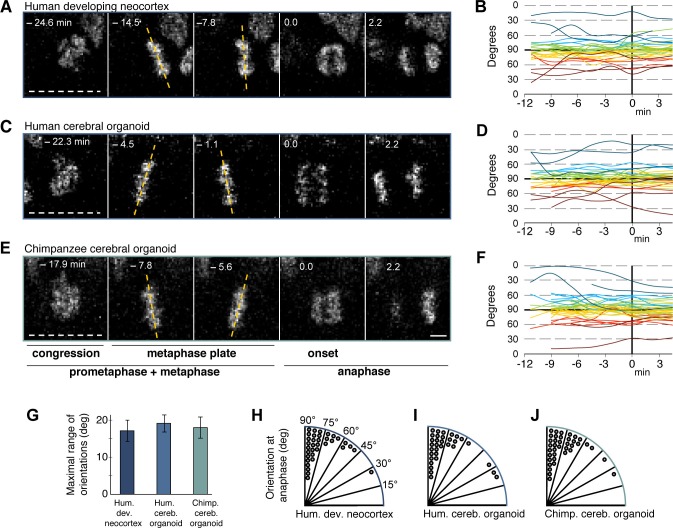
Figure 4. Spindle orientation variability is similar between APs of human developing neocortex, human organoids and chimpanzee organoids.
Live tissue imaging of spindle orientation, as reported by chromosome plate orientation, in organotypic slice culture of developing neocortex and cerebral organoids. Measurements were started after all chromosomes had formed a tight metaphase plate. 0 min is anaphase onset. Time-lapse is ∼1.1 min. (A,C,E) APs in a coronal slice of 13 wpc human frontal neocortex (A), in a slice of a D30 human cerebral organoid from iPSC line SC102A-1 (C), and in a slice of a D30 chimpanzee cerebral organoid from iPSC line Sandra A (E). The time indicated on each image is when that image was taken, relative to anaphase onset (0 min). White dashed lines, ventricular surface. Yellow dashed lines indicate the two metaphase plate orientations with the greatest difference to each other. Scale bar, 5 μm. (B,D,F) Quantification of all orientations of the chromosome plates from the beginning of the metaphase plate stage to anaphase, for APs in the three respective tissues described in (A,C,E). To facilitate tracing, individual tracks are colour-coded according to the initial range of the track, and the 90°−0° range is depicted twice (green and yellow, 90°−75°; cyan and red, 75°−60°; blue and dark red, 60°−0°; 90° indicates perfectly vertical chromosome plates). (G) Maximal range of chromosome plate orientations for APs, from the beginning of the metaphase plate stage to anaphase onset, as determined in the measurements shown in (B,D,F). Data are the mean ± SEM of ≥34 APs from 3 independent experiments each. (H,I,J) Orientation of chromosome plates at 2.2 min after anaphase onset, which indicates the predicted plane of cleavage, as determined in the measurements shown in (B,D,F). 90° indicates a perfectly vertical cleavage plane.

