. 2016 Oct 31;5:e15797. doi: 10.7554/eLife.15797

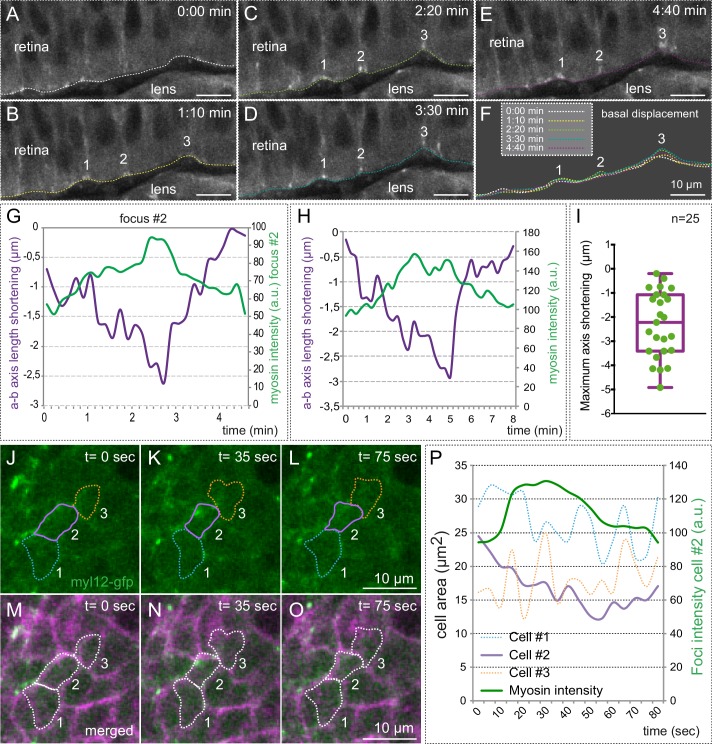
Figure 6. Myosin accumulation correlates with basal membrane displacement.

(AE) Time series of optical sections from tg(actb1:myl12.1-eGFP) embryos show discrete myosin foci (labeled 1, 2, 3) and basal surface displacement. (F) Basal edges were color-coded for each time point and overlapped to illustrate the transient indentations of the basal surface associated to myosin foci. (GH) Quantitative recording over time of myosin intensity and apico-basal axis shortening for a couple of representative foci. The focus in G is #2 in AF. (I) Box plot showing the maximum shortening of the a-b axis for 25 foci from 12 different retinas. (JO) Correlative analysis of basal area (revealed by lyn-tdTomato) and myosin dynamics is shown for three neighbor cells (color-coded). (P) Quantitative analysis of cell area changes and myosin intensity for the three neighboring cells. Note that only the cell accumulating myosin contracts. Scale bars =10 µm.

DOI: http://dx.doi.org/10.7554/eLife.15797.018

Figure 6.

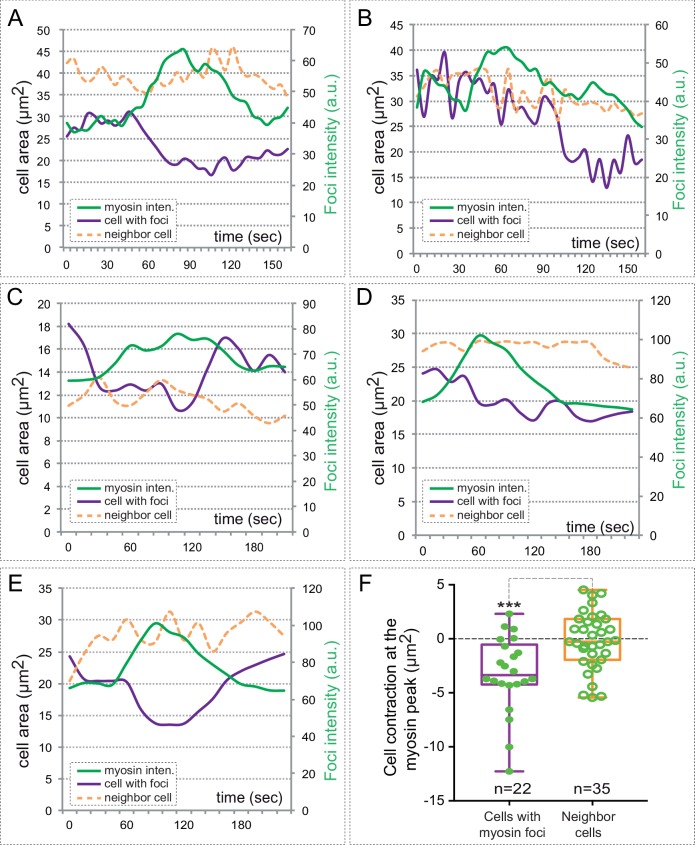
Figure 6—figure supplement 1. Myosin accumulation correlates with basal contraction.

Figure 6—figure supplement 1.

(AE) Quantitative analysis of myosin intensity (green lines) and cell area changes for five cells containing myosin foci (purple lines) and their neighboring cells (orange dashed lines). Note the contraction of the cells upon myosin accumulation. (F) Box plot showing average cell contraction (µm2) at the peak of myosin accumulation for 22 different cells containing myosin foci (purple) and 35 neighboring cells. Myosin accumulating cells undergo a significant contraction of their basal area, as determined by T-test.
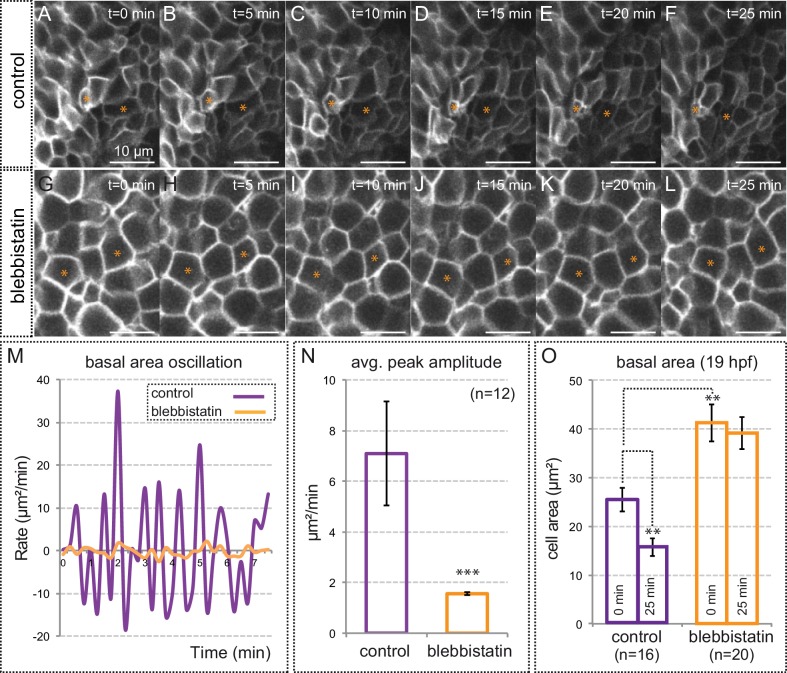
Figure 6—figure supplement 2. Myosin inhibition impairs basal constriction.

Figure 6—figure supplement 2.

(AL) Live-imaging analysis of cell area dynamics in control (AF) and blebbistatin-treated (GL) tg(vsx2.2:GFP-caax) embryos. Progressive constriction is observed in individual cells (asterisk) in control, but not in blebbistatin-treated tissue. (M) Basal area variation rate is shown for representative control and blebbistatin-treated cells. (N) Average peak amplitude of the cell area rate is considerably reduced in treated cells (T-test, n = 12). (O) Blebbistatin treatment significantly inhibited basal constriction over a considered period of 25 min, blocking the cells in a relaxed state (T-test). Scale bars = 10 µm.
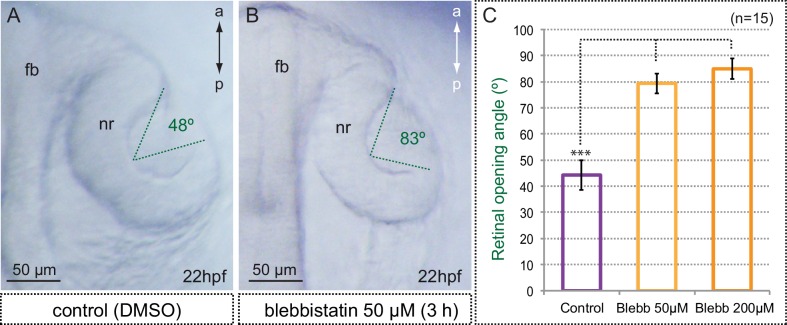
Figure 6—figure supplement 3. Myosin inhibition interferes with optic cup folding.

Figure 6—figure supplement 3.

(A,B) Optic cup folding is also impaired in blebbistatin-treated embryos as assessed by the retinal opening angle (indicated with green dashed lines). (C) Quantitative analysis of retinal opening angles show a significant delay in optic cup folding in embryos treated with 50 and 200 µM blebbistatin (one-way ANOVA followed by Tukey test, n = 15). fb = forebrain; nr = neural retina. Scale bars = 50 µm.