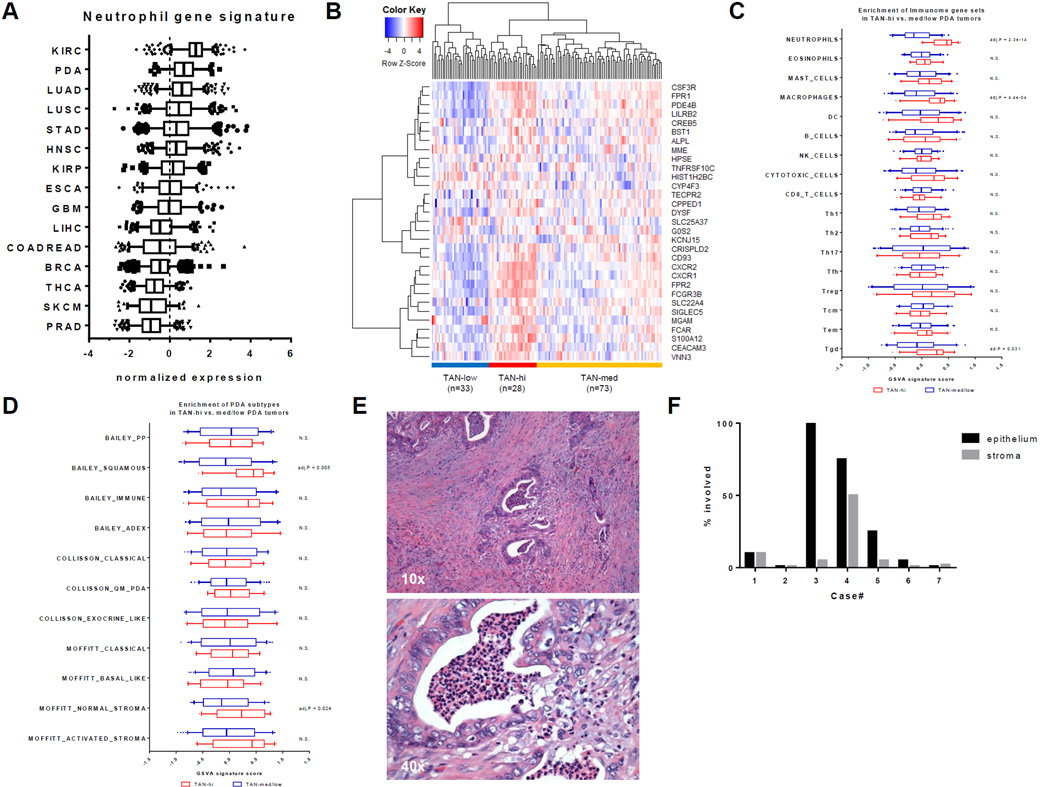
Figure 1. A subset of human PDA have significant TAN involvement.
(A) Normalized expression (z-scores) of the neutrophil gene signature in primary tumors across 15 TCGA cancer cohorts. Boxplot whiskers at 5–95th percentile. Dashed line represents the average expression value. (B) Clustering of 134 human TCGA PDA samples using the 31 genes in the neutrophil signature into TAN-high, TAN-med, and TAN-low groups. (C) Comparison of GSVA signature scores for 17 different immune cell types between TAN-high and TAN-med/low groups. Holm-Sidak multiple comparison test; N.S. = Not Significant. (D) Comparison of GSVA signature scores for PDA subtypes between TAN-high and TAN-med/low groups. Holm-Sidak multiple comparison test; N.S. = Not Significant. (E) H&E stain of a representative, resected human PDA sample (n = 12) showing TAN involvement in the cancer epithelium, stroma, and lumen. (F) Bar graph of the percentage of cancer epithelium or stroma involved in each of the 7 PDA cases with TAN infiltration.

