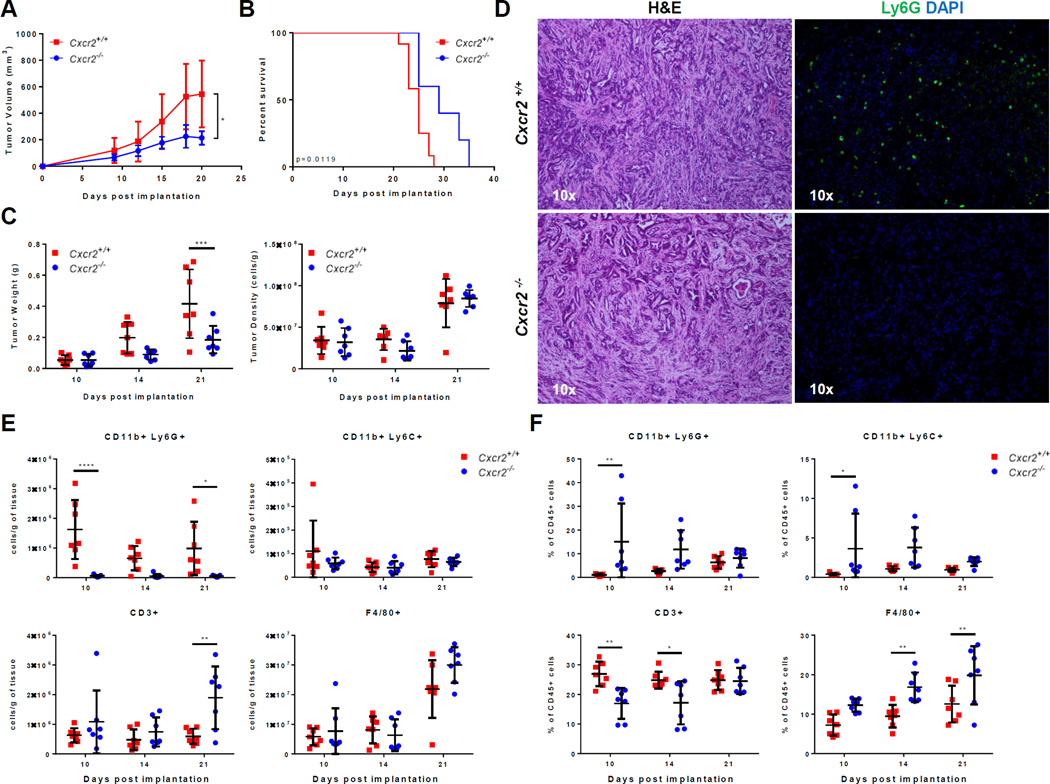
Figure 5. CXCR2 ablation specifically prevents TAN accumulation and inhibits tumor growth.
A–F, An independent cohort of Cxcr2−/− and Cxcr2+/+ mice was used for Figures A, C, and E–F, another cohort for Figure B, and another cohort for Figure D. Each of these experiments was done once unless otherwise indicated. (A) 4662 PDA tumor growth in Cxcr2−/− compared to Cxcr2+/+ littermates after subcutaneous implantation (n = 7 per group). Graph shows mean ± s.d. of one experiment. *, P ≤ 0.05 on Day 21 (2-way ANOVA, Dunnett’s multiple comparison test). The observed difference in tumor growth until Day 21 was observed in a second, independent experiment. (B) Kaplan-Meier survival analysis of Cxcr2−/− (n = 6) compared to Cxcr2+/+ (n = 10) littermates subcutaneously implanted with 4662 PDA tumors. (P value = 0.0119, log rank test). This result is representative of two independent experiments. (C) Comparison of tumor weights and cell-density in Cxcr2−/− compared to Cxcr2+/+ hosts on Day 10, 14, and 21 (n = 7 per group/day). Graph shows mean ± s.d. of one experiment. ***, P ≤ 0.001 (2-way ANOVA, Sidak’s multiple comparison test). (D) Representative H&E (10×) and Ly6G-DAPI (10×) stain in Cxcr2−/− compared to Cxcr2+/+ controls (n = 8 per group). (E) Flow cytometric measurement of the density of CD11b+Ly6G+ TANs, CD11b+Ly6C+ monocytes, CD3+ T cells, and F4/80+ macrophages in the tumors of Cxcr2−/− and Cxcr2+/+ littermates on Day 10, 14, and 21 (n = 7/day/group). Graph shows mean ± s.d. of one experiment. *, P ≤ 0.05; **, P ≤ 0.01; ***, P<0.001 (2-way ANOVA, Sidak’s multiple comparison test). The observed differences of TANs, monocytes, T cells, and macrophages on Day 21 were repeated in another independent experiment. (F) The percentage of CD11b+Ly6G+ TANs, CD11b+Ly6C+ monocytes, CD3+ T cells, and F4/80+ macrophages in the spleens of Cxcr2−/− and Cxcr2+/+ littermates on Day 10, 14, and 21 (n = 7/day/group). Graph shows mean ± s.d. of one experiment. *, P ≤ 0.05; **, P ≤ 0.01 (2-way ANOVA, Sidak’s multiple comparison test).

