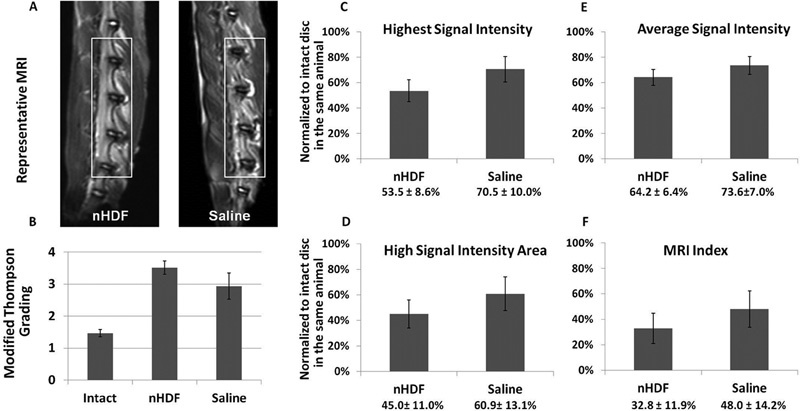
Fig. 4.

Magnetic resonance imaging (MRI) analysis 8 weeks after neonatal human dermal fibroblast (nHDF) or saline treatment. (A) Representative MRI scans of the lumbar spine of rabbits at 8 weeks post-treatment. (B) Average MRI grading using the Modified Thompson Grading Scale. (C to F) Highest signal intensity, average signal intensity, and high signal intensity areas were calculated to determine the MRI index (nucleus pulposus [NP] average signal intensity × NP area). Error bars represent the standard error of the mean.
