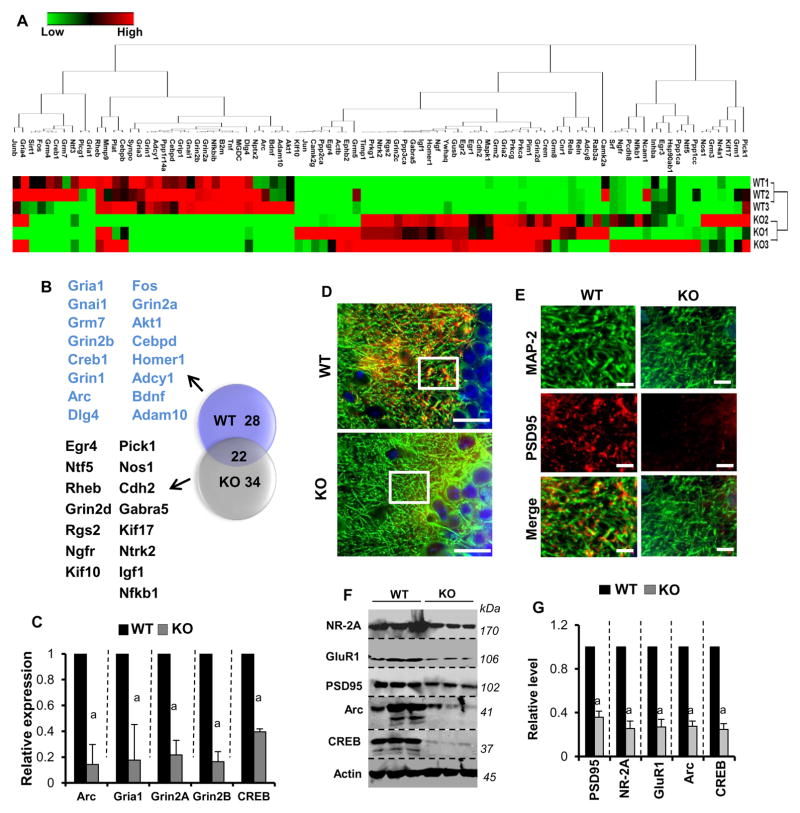
Figure 1. PPARα is critical in regulating the expression of synaptic molecules in hippocampal neurons.
A) Heat map analysis shows the PCR-based microarray analysis of plasticity-associated genes in the hippocampus of WT and αKO (Ppara-null) mice. Three mice were used in each group. B) Venn diagram of plasticity-associated genes shows the number of genes inhibited (28; red circle), stimulated (34; green circle) and unchanged (22; overlapped region) in Ppara-null hippocampus. C) Real-time PCR analyses of Arc, Creb, Grin2a, Grin2b, and Gria1 mRNAs were performed to confirm the array results. Results are mean ± SEM of three mice. ap<0.001 vs WT. D) Hippocampal tissue of 6- to 8-week-old WT (n=3) and Ppara-null (n=3) mice were immunostained for MAP-2 (green) and PSD-95 (red). The representative image was taken from CA1 region of the hippocampus. Scale bar = 10μm. E) The magnified view of region enclosed in the box is shown in the image. Scale bar = 10 μm. Results represent analysis of three hippocampal sections of each of three mice per group. The expression of NR-2A, GluR1, PSD95, Arc, and CREB in hippocampal tissue of WT (n=3) and Ppara-null (n=3) mice was further assessed by Western blot (F) followed by densitometric analyses (G) after normalizing with actin. For raw uncut blots, please see Supplementary Figure 13A. Results are mean ± SEM of three mice. ap<0.001 vs WT.

