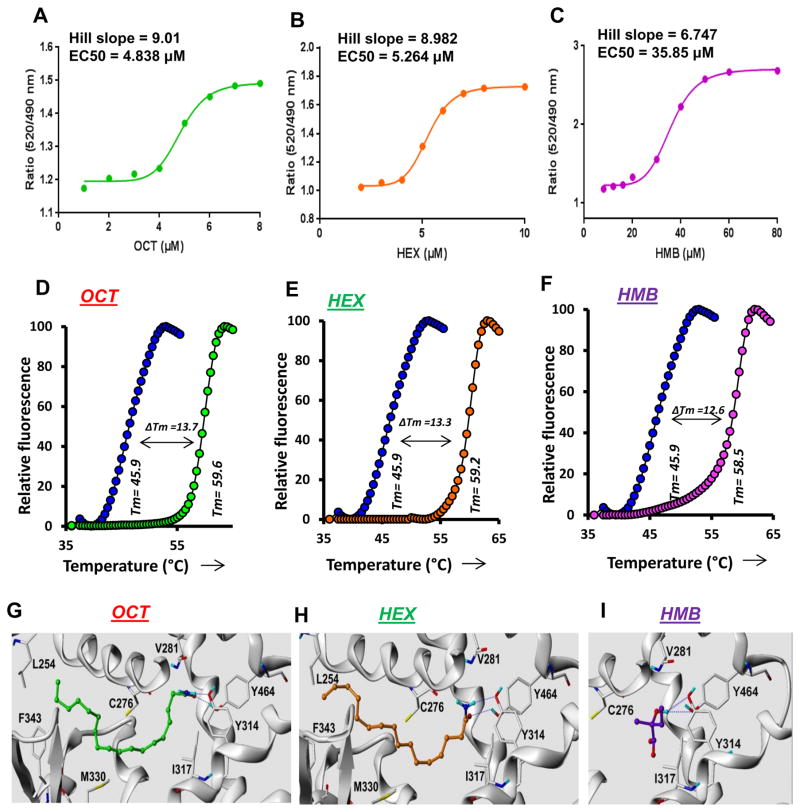
Figure 3. Analyses of the interaction of OCT, HEX and HMB with PPARα by TR-FRET and thermal shift.
TR-FRET analyses were performed and fitted curves are shown for OCT (A), HEX (B) and HMB (C). Dose response curves were plotted as a ratio of fluorescence response with increasing doses of agonists. Graph-pad prism 7 software was used to draw a sigmoidal curve-fit. Respective EC50 (4.838 μM for OCT, 5.264 μM for HEX and 35.85 μM for HMB) and hill slope (9.01 for OCT, 8.982 for HEX and 6.747 for HMB) values were calculated based on sigmoidal curve-fit equation: Y=Bottom + (XHillslope)*(Top-Bottom)/(XHillslope + EC50Hillslope). Thermal-shift assay of OCT (D), HEX (E) and HMB (F) was performed using 5 μM OCT, 5 μM HEX and 25 μM HMB as described under the Materials and Method section.
Ribbon representations of superposed structures of PPARα ligand binding pocket along with its ligands OCT (G), HEX (H) and HMB (I) are shown. Blue dotted lines represent potential hydrogen bonds. Results are confirmed by three independent experiments.

