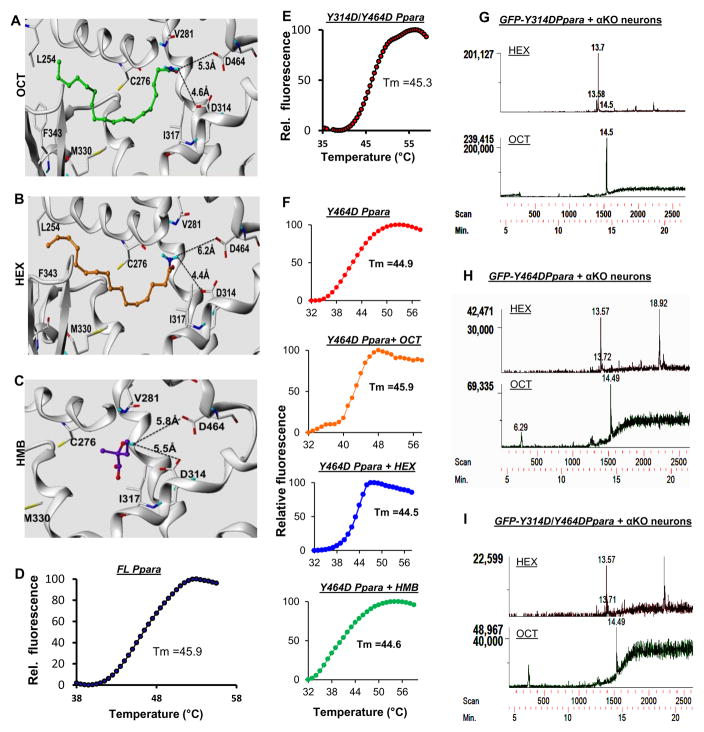
Figure 4. Interaction between ligands and PPARα at the molecular level.
Ribbon representations of superposed structures of Y464D/Y314D-PPARα ligand binding pocket along with OCT (A), HEX (B) and HMB (C). Thermal shift assays of FL-PPARα (D) and Y314D/Y464D-PPARα (E) proteins. Tm represents the melting temperature. F) Thermal shift assay for Y464D-PPARα alone and together with three ligands. GC-MS analyses in GFP-affinity purified extracts of Ppara-null hippocampal neurons transduced with lentivirions containing GFP-Y314D-Ppara (G), GFP-Y464D-Ppara (H), and GFP-Y314D/Y464D-Ppara (I).

