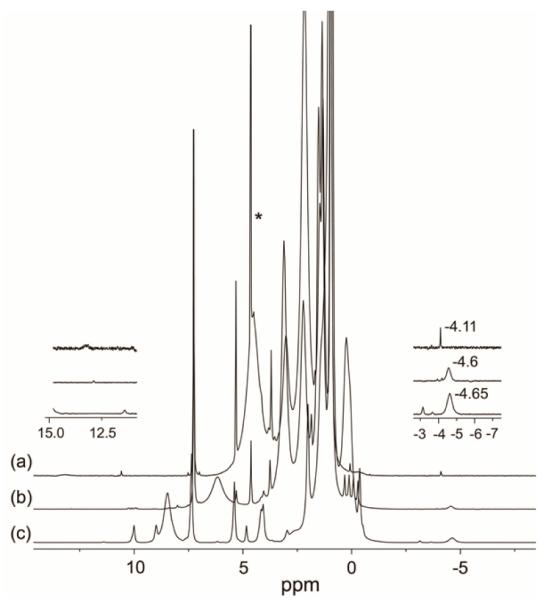
Fig. 5.

1H NMR spectra (in CDCl3) of the reaction to generate (OEP)Fe(NO)H, highlighting the upfield and downfield regions of (a) (OEP)Fe(NO)H (top spectrum), (b) (OEP)Fe(H) byproduct (middle spectrum), and (c) (OEP)Fe(H) from the control reaction of [(OEP)Fe]OTf with hydride (bottom spectrum). The peak labeled * is due to the H2 decomposition product (see text).
