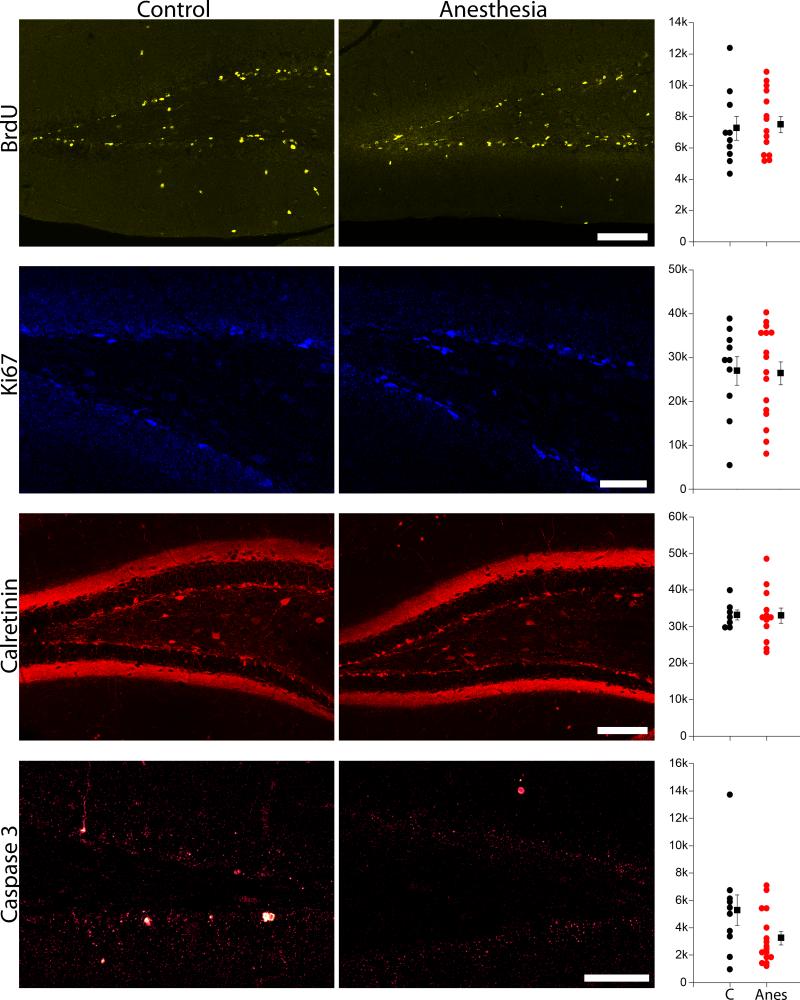
Figure 6.
BrdU, Ki67, calretinin and caspase 3 labeling in P35 control (C) and P21 anesthesia + 14 day (Anes) mice. Scale bars = 100 μm (BrdU, calretinin) and 50 μm (Ki67 and caspase 3). Scatterplots shows the density of labeled cells in the dentate granule cell body layer for each corresponding image set. Circles represent individual animal means, while squares reflect group means ± SEM. The two groups were statistically equivalent for all measures (P>0.05, Student's t-test).

