Fig. 3.

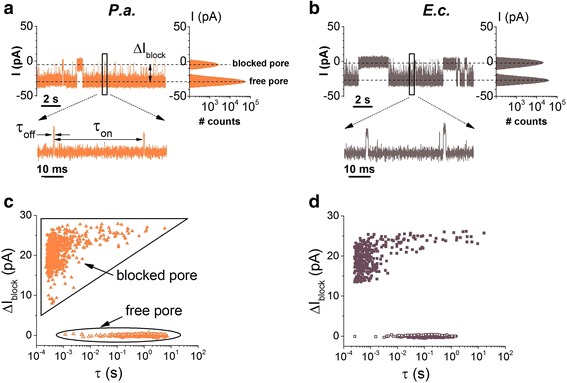
Demonstration of individual detection of P. aeruginosa (P.a.) and E. coli (E.c.) with the α-HL. Original current recordings showing reversible current blockage events induced by the association of P.a. (a) and E.c. (b), respectively, with the α-HL. The amplitude histograms showed on the right side indicate the nearly complete ionic flow obstruction through the nanopore by either bacterium. Selected time intervals characterizing the frequency (τ on) and duration (τ off) of bacteria-α-HL interactions are shown in the inset of a. c, d Scatter plots of current blockade versus dwell time of blockade events reflecting the P. aeruginosa (P.a.) and E. coli (E.c.) interaction with the α-HL. The distinct states of the nanopore, i.e., free and temporarily blocked by a bacterium, are denoted in c. The applied transmembrane potential was ΔV = −80 mV
