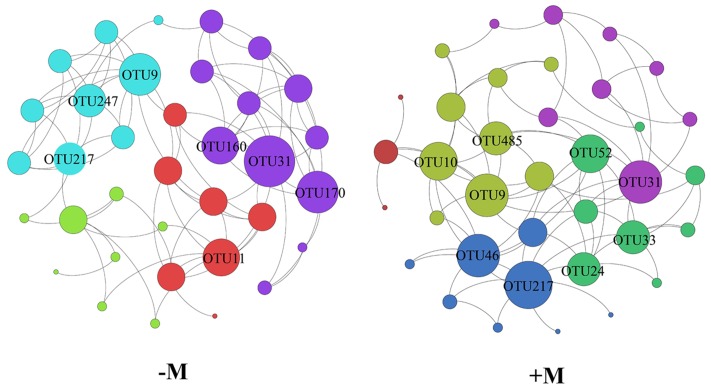
FIGURE 5.
Network analysis of the -M and +M treatments based on Pearson correlations. The different color nodes belong to different modules. -M: the treatments without organic manure with modularity resolution of 0.540 and 4 communities; +M: the treatments with organic manure with modularity resolution of 0.438 and five communities.

