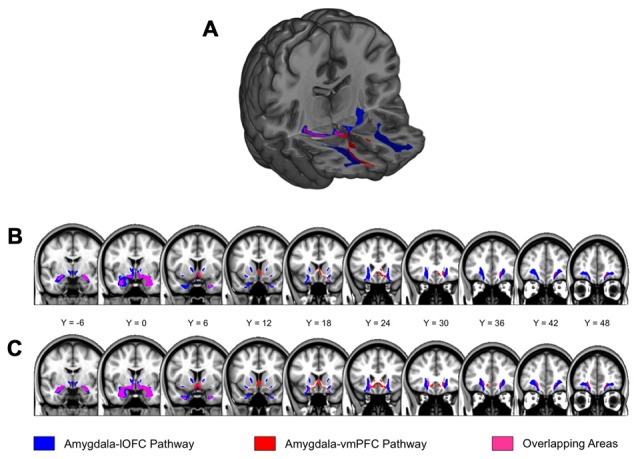
Figure 2.

Amygdala-lateral orbitofrontal cortex (lOFC) and amygdala-ventromedial PFC (vmPFC) pathways. (A) Results from probabilistic tractography illustrating the amygdala-lOFC pathway (blue), the amygdala-vmPFC pathway (red), and the overlapping pathway (purple). Tracts are displayed at a group threshold of 50%. (B) Pathways depicted on coronal slices of the brain, defined at a group threshold of 50%. (C) A lenient group threshold of 30% was used for the left amygdala-vmPFC pathway. The main findings did not change when this threshold was applied to the left amygdala-vmPFC pathway.
