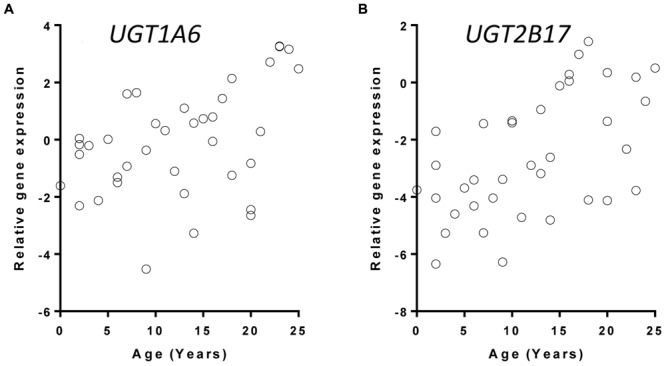
FIGURE 1.

Correlation between age and UGT gene expression with UGT1A6 (A) and UGT2B17 (B) as examples. UGT gene expression were quantified with real-time PCR and normalized to the expression of beta-actin gene. Data were plotted as the +log2 transformed relative ratios (UGT/housekeeping gene).
