Figure 2.

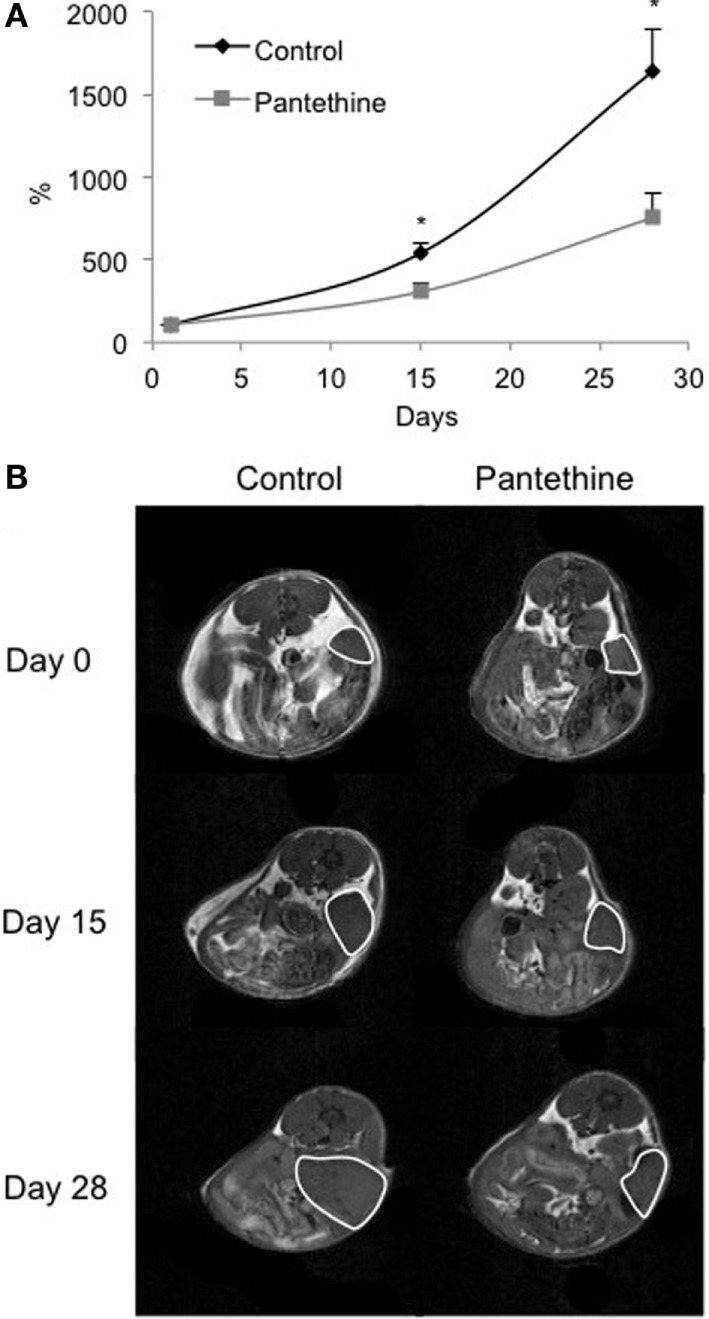
Normalized tumor growth curves from control mice and pantethine-treated mice (A) and representative T1-weighted images of a central slice of tumors imaged at days 0, 15, and 28 of a control mouse (left column) and a treated mouse (right column) (B). n = 13 and 14, respectively; *P < 0.05.
