Figure 7.

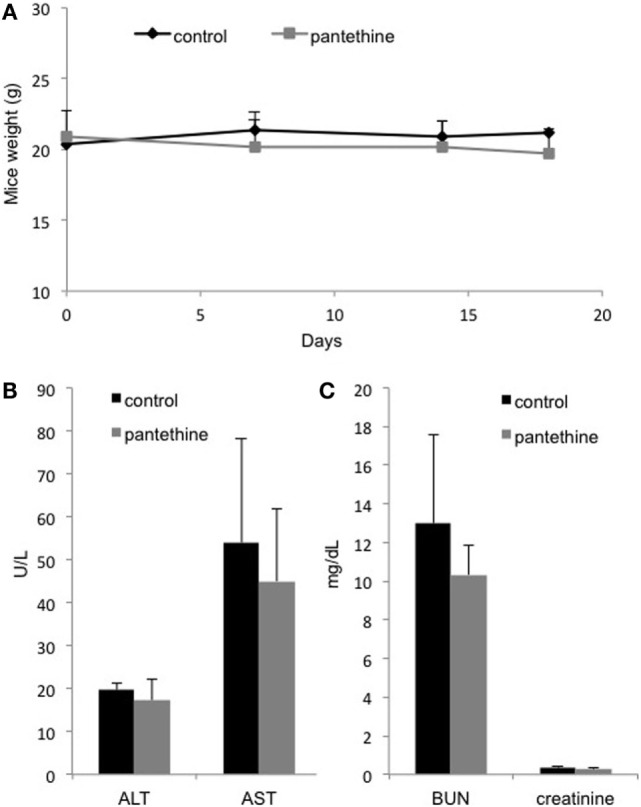
(A) Weight curves from control and treated mice. Serum levels of ALT, AST, (B) BUN, and creatinine (C) in treated and control mice. n = 5; mean ± SD are presented.

(A) Weight curves from control and treated mice. Serum levels of ALT, AST, (B) BUN, and creatinine (C) in treated and control mice. n = 5; mean ± SD are presented.