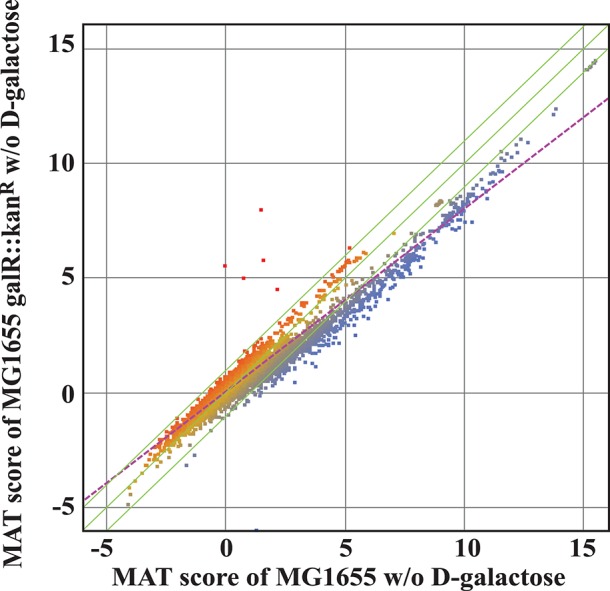
Figure 6.

MAT analysis of the transcriptome of wild type and ΔgalR cells grown in M63 minimal medium. Green lines represent the mean ± 2SD, while the purple dotted line represents the regression line. The red represents the up genes and the blue represents the down genes. There is a marked down-regulation of many genes in the absence of GalR.
