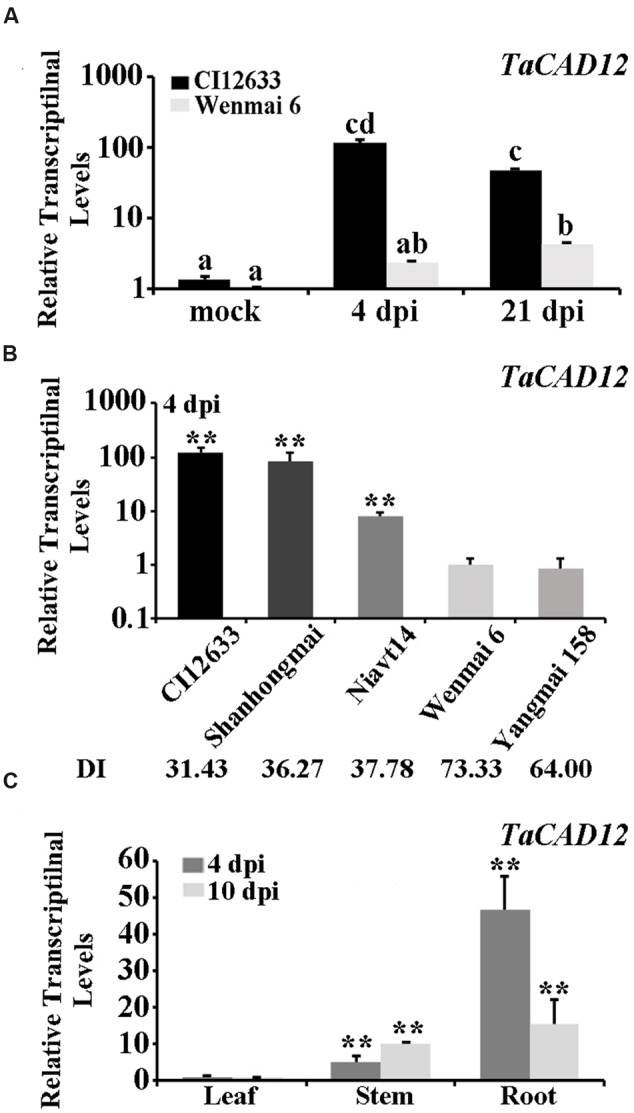
FIGURE 1.

Transcriptional patterns of TaCAD12 in wheat stems after R. cerealis inoculation analyzed by Q-RT-PCR. (A) The relative transcriptional levels of TaCAD12 in the sharp eyespot-resistant wheat line CI12633 and the susceptible wheat line Wenmai 6 after inoculation with R. cerealis R0301 for 4 and 21 days or mock-treatment. The mock indicates an inoculation without R. cerealis. The transcriptional levels with different letters are significantly different from each other based on statistical comparisons (Student’s t-test, ∗∗P < 0.01). (B) The relative transcriptional levels of TaCAD12 in sharp eyespot-resistant, moderately resistant, susceptible, and moderately susceptible wheat lines were measured after inoculation with R. cerealis R0301 for 4 days. The relative transcriptional levels of TaCAD12 in different wheat lines were calculated relative to that of Wenmai 6. DI indicates the sharp eyespot disease index in each wheat line. (C) Transcription of TaCAD12 in roots, stems and leaves of the wild-type (WT) Yangmai 16 at 4 and 10 dpi with R. cerealis R0301. Three technical replicates were averaged and statistically analyzed using Student’s t-test (∗∗P < 0.01). Bars indicate standard error of the mean (SEM).
