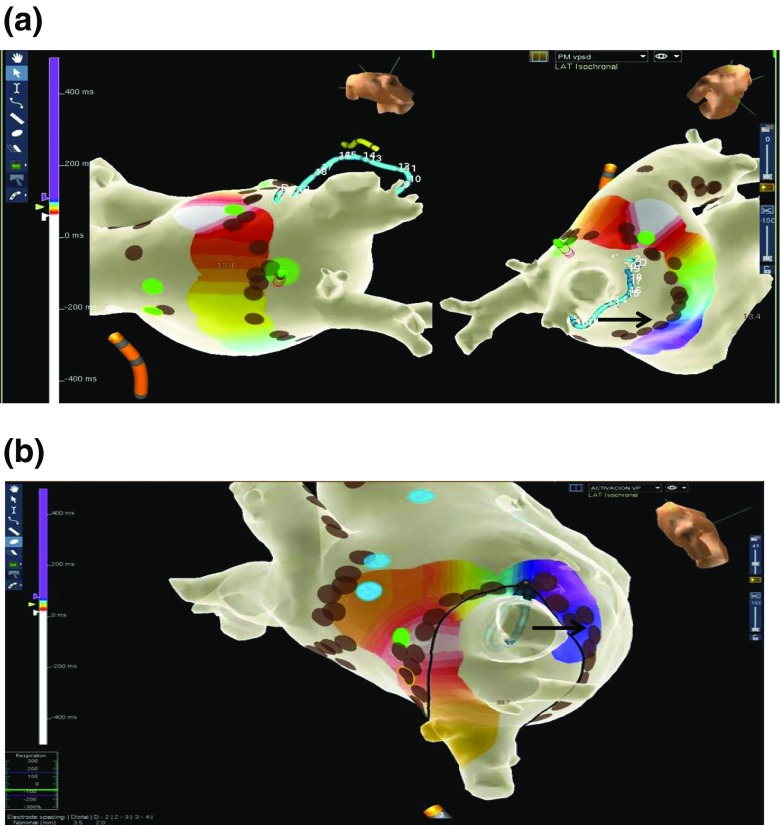
Fig. 2.
Representative examples of color-codded activation maps showing one gap on the ablation line around PV. All panels depict the LA anatomy with an activation map obtained with a limited number of points around ipsilateral PV, during PV pacing. The brown dots represent RF applications sites from the initial ablation line and the green dots depict the successful RF application based on the pace and map maneuver. The black arrows indicate earliest sites inside the PV during sinus rhythm. Panel a: Gap on the roof of the right superior PV. The activation map, was obtained during right inferior PV pacing. On this site, one radiofrequency application resulted in isolation of both right PV. Panel b: Gap on the posterior aspect of the right superior PV

