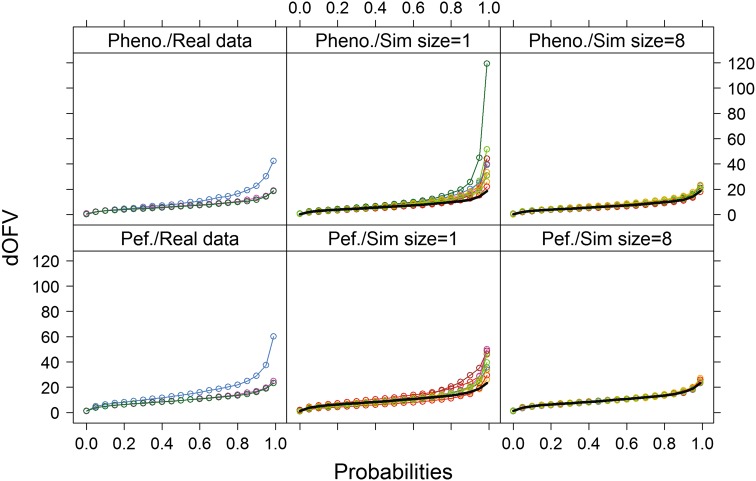
Fig. 1.
dOFV distribution plots for the two real data examples. Left panels provide bootstrap dOFV distributions for the real data (blue), the theoretical dOFV distribution (green) and the SSE dOFV distribution (pink). Middle and right panels provide bootstrap dOFV distributions for the simulated datasets of equal and 8-fold increased size (colors), as well as the theoretical dOFV distribution (black solid line). Pheno. phenobarbital, Pef. pefloxacin

