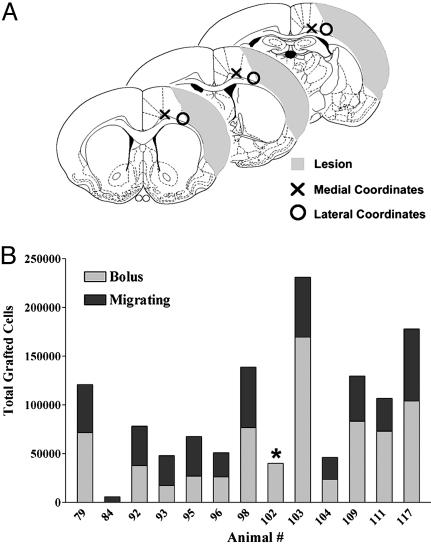
Fig. 1.
Survival of hCNS-derived neurospheres in the ischemic brain. (A) Schematic of lesion (shaded area) and transplant coordinates. The three sections represent the three levels on the A-P axis where cells were transplanted. Cells transplanted close to the lesion core (○) showed reduced survival; cells transplanted more medially (×) further from the lesion showed robust survival. The medial coordinates were used for this study. (B) Quantitation of the number of surviving cells in rats subjected to dMCAo 4 wk posttransplant. The gray bar indicates the number of cells in the graft bolus; the black bar represents the number of cells migrating from the graft (the asterisk denotes that the migrating population was not counted in this animal). On average, 100,147 ± 28,944 cells survived.

